A confusion matrix is a simple table that helps you understand how well a classification model is performing. It compares what your model predicted with the actual labels from your data. Instead of just showing accuracy, it breaks down the results into four clear parts: true positives, true negatives, false positives, and false negatives.
This breakdown gives you a much clearer picture of your model’s strengths and weaknesses. It helps answer questions like: Is the model missing too many actual positives? Is it predicting too many false alarms? That’s why the confusion matrix is such an essential tool in machine learning, especially when working with real-world problems where errors can be costly.
Why the Confusion Matrix Is Better Than Just Accuracy
Accuracy tells you how many predictions were correct. But it doesn’t show you what kind of mistakes your model is making.
For example, if your data has 95% of one class and 5% of another, a model that always predicts the majority class will still get 95% accuracy. But it will completely fail to detect the minority class. That’s where the confusion matrix helps.
What the Confusion Matrix Tells You
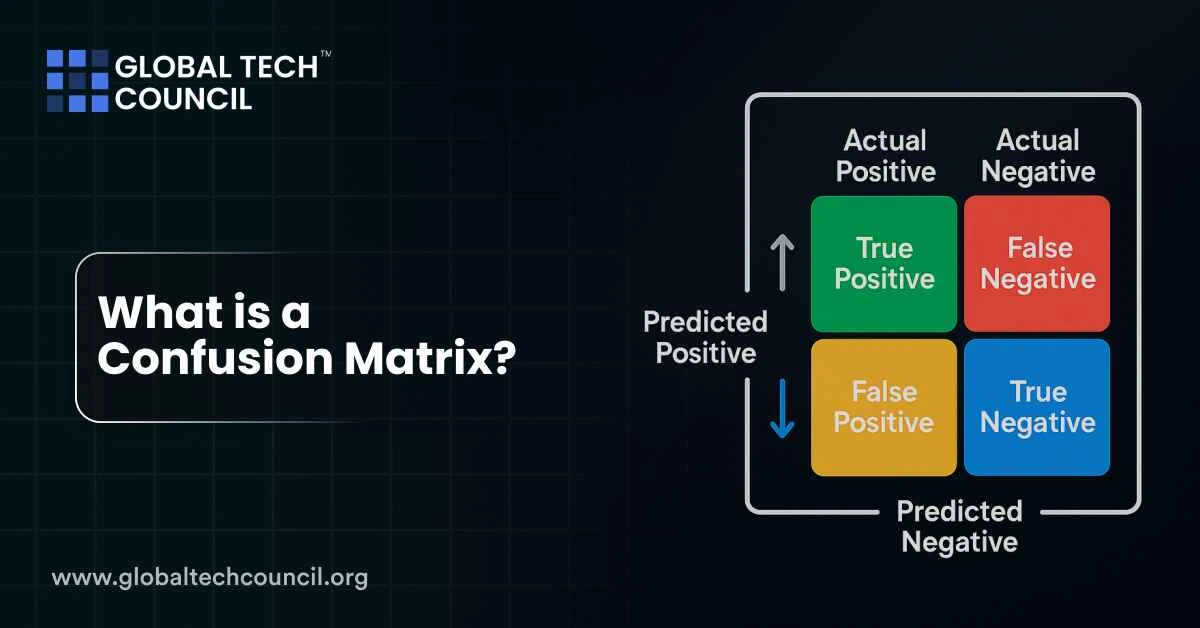
The matrix shows four types of outcomes:
- True Positives (TP): The model correctly predicted the positive class
- True Negatives (TN): The model correctly predicted the negative class
- False Positives (FP): The model wrongly predicted positive when it was actually negative
- False Negatives (FN): The model wrongly predicted negative when it was actually positive
These four values can then be used to calculate more helpful metrics.
Key Metrics Derived From the Confusion Matrix
Once you have TP, TN, FP, and FN, you can calculate:
- Precision = TP / (TP + FP) — How many predicted positives were actually positive
- Recall = TP / (TP + FN) — How many actual positives were correctly predicted
- F1-Score = 2 * (Precision * Recall) / (Precision + Recall) — Balance between precision and recall
- Specificity = TN / (TN + FP) — How many negatives were correctly identified
These metrics are more useful than just accuracy, especially in healthcare, fraud detection, or any field where one type of error is more costly than the other.
Common Use Cases Where It Matters
- Medical Diagnosis — You don’t want to miss a disease (FN), even if it means more false alarms (FP)
- Spam Detection — You want to avoid marking real emails as spam (FP)
- Credit Fraud Detection — Better to flag a few false positives than miss real frauds
Understanding what kind of errors matter most helps in setting up your model and tuning its thresholds.
Confusion Matrix Components
| Outcome Type | Prediction vs Reality | What It Represents |
| True Positive (TP) | Model says positive, and it’s actually positive | Correct positive prediction |
| True Negative (TN) | Model says negative, and it’s actually negative | Correct negative prediction |
| False Positive (FP) | Model says positive, but it’s actually negative | False alarm (Type I error) |
| False Negative (FN) | Model says negative, but it’s actually positive | Missed detection (Type II error) |
Multi-Class Confusion Matrices
Confusion matrices aren’t just for binary classification. They can handle multiple classes too. In that case, you get an NxN matrix where each row is the actual class and each column is the predicted class. This helps identify if the model confuses one class with another frequently.
Let’s say you’re classifying three types of flowers. A multi-class confusion matrix would show whether the model often confuses daisies with tulips, or lilies with daisies. This can guide improvements in training data or model structure.
Emerging Uses and Research Trends in 2025
Advanced use cases of confusion matrices are becoming more common:
- Hierarchical confusion matrices in complex systems (e.g., nested categories in image classification)
- Layered matrix visualizations to show model confidence and error severity
- Psychometric applications to map human bias in annotation
These innovations are becoming standard in industries like autonomous vehicles, medical AI, and robotics.
If you’re working on real-world AI projects and want to dive deeper into evaluation techniques, check out this Deep tech certification.
Key Evaluation Metrics from the Confusion Matrix
| Metric | Formula | What It Measures |
| Precision | TP / (TP + FP) | How accurate the positive predictions are |
| Recall | TP / (TP + FN) | How well actual positives are identified |
| Specificity | TN / (TN + FP) | How well actual negatives are identified |
| F1-Score | 2 * (P * R) / (P + R) | Balance between precision and recall |
When Should You Use a Confusion Matrix?
Anytime you care about the type of error your model is making. This includes:
- Imbalanced datasets
- Sensitive applications like healthcare or security
- When tuning models using precision/recall trade-offs
If you’re working in business or product teams trying to make sense of ML performance, consider getting certified. A good start is the Data Science Certification, especially if you want to go beyond accuracy reports.
And for decision-makers or growth leaders who want to understand how AI metrics impact KPIs, the Marketing and Business Certification is built for that.
Conclusion
A confusion matrix is more than a table — it’s a window into how your model behaves. By breaking down each type of prediction and mistake, it lets you measure real-world performance, not just a score.
In 2025, as models become more powerful, understanding their failures becomes just as important as celebrating their wins. Whether you’re a data scientist, analyst, or product lead, confusion matrices should be a regular part of your workflow.