

What is a Confusion Matrix?
 Tosh Marketing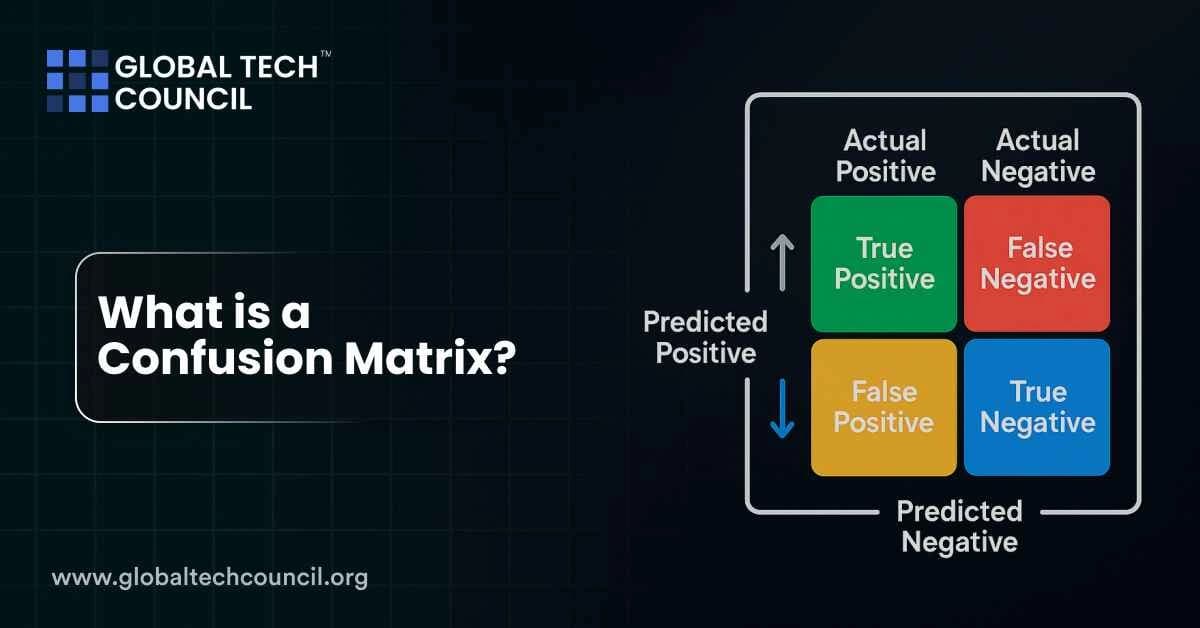
A confusion matrix is a simple table that shows how well a classification model performs by comparing its predictions with the real answers. It tells you not only how often a model is right, but also exactly how it is wrong. That detail matters because a model with 95% accuracy can still fail at the one thing you care about. Whether you are a student building your first classifier or a professional validating a fraud detection system, understanding this table is a core skill. If you want to build that skill in a structured way, a program such as the Certified Data Science Developer certification covers model evaluation alongside the rest of the data science workflow. This guide explains the confusion matrix in plain language, with examples, formulas, code and common mistakes.
Confusion Matrix Definition in Simple Words
A confusion matrix is a table that summarizes the results of a classification model by counting correct and incorrect predictions for each class. Each row usually represents the actual class and each column represents the predicted class, although some tools flip this layout, so always check the axis labels.

Think of a spam filter. Every email is either spam or not spam in reality, and the filter also predicts spam or not spam. The confusion matrix counts how many emails fall into each of the four possible combinations. The word "confusion" simply refers to the places where the model gets confused and mixes up one class with another.
The Four Parts of a Confusion Matrix
Most beginners find the matrix easy once they learn four terms. Here the "positive" class is the event you are trying to detect, such as a disease, a fraud case or a spam email.
Predicted Positive | Predicted Negative | |
|---|---|---|
Actual Positive | True Positive (TP) | False Negative (FN) |
Actual Negative | False Positive (FP) | True Negative (TN) |
True Positive (TP)
The model predicted positive and the real answer is positive. A spam email correctly sent to the spam folder is a true positive.
True Negative (TN)
The model predicted negative and the real answer is negative. A normal email correctly kept in your inbox is a true negative.
False Positive (FP)
The model predicted positive but the real answer is negative. An important email wrongly marked as spam is a false positive. This is also called a Type I error.
False Negative (FN)
The model predicted negative but the real answer is positive. A spam email that slips into your inbox is a false negative. This is also called a Type II error.
A quick memory trick: the second word (positive or negative) tells you what the model predicted, and the first word (true or false) tells you whether that prediction was correct.
Why the Confusion Matrix Matters in Machine Learning
Accuracy alone can be dangerously misleading. Imagine a bank with 1,000 transactions, of which only 10 are fraud. A lazy model that labels every transaction as legitimate would be 99% accurate, yet it catches zero fraud. The confusion matrix exposes this problem instantly, because the true positive count would be zero and the false negative count would be 10.
This table is the foundation of nearly every classification metric. It helps you:
See which types of errors your model makes
Compare models fairly when classes are imbalanced
Decide which error is more costly for your business
Tune thresholds to favor safety or convenience
Explain results to non-technical stakeholders
When datasets are large and messy, evaluation also depends on how data is collected and processed at scale. Professionals who work with high-volume pipelines often build that foundation through programs such as the Certified Big Data Expert certification, since reliable metrics start with reliable data.
A Worked Example With Real Numbers
Suppose a model screens 100 patients for a disease. In reality, 50 patients have the disease and 50 do not. After running the model, you get these results:
Predicted Sick | Predicted Healthy | |
|---|---|---|
Actually Sick | 40 (TP) | 10 (FN) |
Actually Healthy | 5 (FP) | 45 (TN) |
Reading this table in plain language:
The model correctly found 40 sick patients.
It missed 10 sick patients and called them healthy.
It wrongly flagged 5 healthy patients as sick.
It correctly cleared 45 healthy patients.
We will reuse these numbers for every metric below.
Key Metrics You Can Calculate From a Confusion Matrix
Accuracy
Accuracy is the share of all predictions that are correct.
Formula: (TP + TN) / (TP + TN + FP + FN)
Example: (40 + 45) / 100 = 0.85, or 85%.
Accuracy works well when classes are balanced and errors cost about the same. It fails on imbalanced data.
Precision
Precision answers this question: when the model says positive, how often is it right?
Formula: TP / (TP + FP)
Example: 40 / (40 + 5) = 0.889, or about 88.9%.
Use precision when false alarms are expensive, such as flagging a good customer as a fraudster.
Recall (Sensitivity or True Positive Rate)
Recall answers this question: of all the real positives, how many did the model find?
Formula: TP / (TP + FN)
Example: 40 / (40 + 10) = 0.80, or 80%.
Use recall when missing a positive case is dangerous, such as cancer screening or security threats.
Specificity (True Negative Rate)
Specificity measures how well the model identifies real negatives.
Formula: TN / (TN + FP)
Example: 45 / (45 + 5) = 0.90, or 90%.
F1 Score
The F1 score combines precision and recall into one number using the harmonic mean. It is useful when you need a balance between the two.
Formula: 2 x (Precision x Recall) / (Precision + Recall)
Example: 2 x (0.889 x 0.80) / (0.889 + 0.80) = about 0.842.
False Positive Rate and False Negative Rate
False Positive Rate = FP / (FP + TN) = 5 / 50 = 0.10
False Negative Rate = FN / (FN + TP) = 10 / 50 = 0.20
Negative Predictive Value
This tells you how often a negative prediction is correct: TN / (TN + FN) = 45 / 55 = about 0.818.
Precision vs Recall: Which One Should You Care About?
There is a trade-off between precision and recall. Making a model more cautious usually raises precision and lowers recall, while making it more sensitive does the opposite. The right choice depends on the cost of each error.
Situation | Costlier Error | Metric to Prioritize |
|---|---|---|
Cancer screening | False negative | Recall |
Email spam filter | False positive | Precision |
Fraud detection | Usually false negative | Recall, with a precision check |
Search engine results | False positive | Precision |
Airport security | False negative | Recall |
Most classifiers output a probability, and you choose a threshold such as 0.5 to turn it into a yes or no. Lowering the threshold catches more positives (higher recall, lower precision). Raising it does the reverse. Looking at the confusion matrix at several thresholds helps you pick the best balance.
How to Read a Confusion Matrix Step by Step
Check the axes. Confirm whether rows are actual or predicted values.
Find the diagonal. In a standard layout, the diagonal holds correct predictions. Bigger numbers there are better.
Look at the off-diagonal cells. These are your errors. Ask which one is more harmful.
Compare class sizes. If one class is much larger, accuracy may hide problems.
Calculate metrics. Choose precision, recall or F1 based on your goal.
Repeat after changes. Re-check the matrix every time you retrain or adjust a threshold.
Confusion Matrix for Multi-Class Problems
The matrix is not limited to yes or no problems. If you classify images into three groups, such as cat, dog and bird, you get a 3 x 3 table. The diagonal still shows correct predictions, and every other cell shows a specific mix-up, such as dogs predicted as cats.
For multi-class models, each class gets its own precision and recall, calculated by treating that class as positive and all others as negative. You can then combine them in three common ways:
Macro average: treat every class equally.
Micro average: pool all predictions together, which favors larger classes.
Weighted average: weigh each class by how many examples it has.
Multi-class matrices are especially helpful for spotting which categories are confused with each other, which can guide you to collect better data or add features.
Confusion Matrix in Python
Python makes this easy with scikit-learn. Here is a short example:
python
from sklearn.metrics import confusion_matrix, classification_report

y_true = [1, 0, 1, 1, 0, 1, 0, 0, 1, 0]
y_pred = [1, 0, 1, 0, 0, 1, 1, 0, 1, 0]

cm = confusion_matrix(y_true, y_pred)
print(cm)
print(classification_report(y_true, y_pred))
In scikit-learn, the output for a binary problem is arranged as [[TN, FP], [FN, TP]], with rows as actual values and columns as predicted values. For a visual version, you can use ConfusionMatrixDisplay to draw a color-coded heatmap, which is easier to share in reports.
Real-World Uses of the Confusion Matrix
Healthcare: Doctors and researchers use it to judge diagnostic tests and AI-assisted imaging, where a false negative can delay treatment.
Finance: Banks evaluate fraud and credit risk models, balancing missed fraud against annoyed customers.
Cybersecurity: Teams measure how well systems detect intrusions and malware.
Manufacturing: Quality control models flag defective products, and the matrix shows how many good items are wrongly rejected.
Natural language processing: Sentiment and intent classifiers are checked for confusion between similar labels.
Emerging technology: Advanced systems that combine AI with areas such as blockchain, security and distributed computing rely on solid evaluation too. Professionals exploring that crossover often study broader topics through a Deep Tech Certification, which helps connect model evaluation with real infrastructure and trust requirements.
Common Mistakes When Using a Confusion Matrix
Relying only on accuracy. Always check precision, recall and F1, especially for imbalanced data.
Mixing up the layout. Libraries and textbooks differ, so verify which axis is actual and which is predicted.
Evaluating on training data. Always build the matrix from test or validation data the model has not seen.
Ignoring business cost. A false negative and a false positive rarely cost the same. Decide which matters more before choosing a metric.
Using one threshold blindly. The default 0.5 is not always the best choice.
Forgetting class imbalance. Consider resampling, class weights or metrics such as the area under the precision-recall curve.
Related Evaluation Tools
A confusion matrix is often paired with other tools:
ROC curve and AUC: shows the trade-off between true positive rate and false positive rate across thresholds.
Precision-recall curve: more informative than ROC when positives are rare.
Matthews correlation coefficient: a single balanced score that uses all four cells.
Cohen's kappa: measures agreement beyond chance.
Log loss: evaluates the quality of predicted probabilities, not just labels.
Using the Confusion Matrix Beyond Data Science
The logic of this table is useful outside technical teams. Marketers use classification models to predict which leads will convert, which customers will leave or which emails will be opened. Here, a false positive means spending budget on someone unlikely to buy, while a false negative means ignoring a valuable prospect. Reading the matrix helps marketing teams set smarter targeting rules and defend their decisions with data. Professionals who want to connect analytics with campaign strategy can strengthen that skill set with a Marketing Certification and apply model evaluation to audience and conversion work.
Final Thoughts
The confusion matrix turns a vague question, "Is my model good?", into a clear and honest answer. It shows the four outcomes of every prediction, makes hidden errors visible and gives you the building blocks for accuracy, precision, recall, specificity and F1. Start with the simple two-by-two table, practice with small examples, then move on to multi-class problems and threshold tuning. Once you can read this table with confidence, you can judge almost any classifier fairly and explain your findings to anyone.
FAQs
1. What is a confusion matrix?
A confusion matrix is a table used to evaluate the performance of a classification machine learning model. It compares the model's predicted classes with the actual classes in the dataset.
2. What are the four components of a confusion matrix?
For binary classification, the four components are True Positive (TP), True Negative (TN), False Positive (FP), and False Negative (FN). Together, they show which predictions were correct and which types of errors the model made.
3. What is a True Positive in a confusion matrix?
A True Positive occurs when a model correctly predicts the positive class. For example, if a model correctly identifies an email as spam, that prediction is a True Positive.
4. What is a True Negative in a confusion matrix?
A True Negative occurs when the model correctly predicts the negative class. For example, correctly identifying a legitimate email as not spam is a True Negative.
5. What is a False Positive?
A False Positive occurs when the model predicts the positive class when the actual class is negative. This is sometimes called a Type I error.
6. What is a False Negative?
A False Negative occurs when the model predicts the negative class even though the actual class is positive. This is also known as a Type II error.
7. How does a confusion matrix work?
The model's predictions are compared against the actual labels and organized into a table. The resulting counts show correct predictions along the diagonal and classification errors in the other cells.
8. What is the difference between a confusion matrix and accuracy?
A confusion matrix provides a detailed breakdown of correct and incorrect predictions, while accuracy summarizes the overall proportion of correct predictions. Accuracy alone may be misleading when classes are highly imbalanced.
9. What is the formula for accuracy using a confusion matrix?
For binary classification, accuracy is calculated as:
Accuracy = (TP + TN) / (TP + TN + FP + FN)
It represents the proportion of all predictions that the model classified correctly.
10. What is precision in a confusion matrix?
Precision measures how many of the observations predicted as positive were actually positive. Its formula is:
Precision = TP / (TP + FP)
High precision means the model produces relatively few false-positive predictions.
11. What is recall in a confusion matrix?
Recall measures how many of the actual positive observations the model correctly identified. Its formula is:
Recall = TP / (TP + FN)
Recall is particularly important when missing a positive case has significant consequences.
12. What is the difference between precision and recall?
Precision focuses on the correctness of positive predictions, while recall focuses on finding as many actual positive cases as possible. The appropriate balance depends on the application's objectives and the relative cost of different errors.
13. What is the F1 score?
The F1 score combines precision and recall into a single metric using their harmonic mean. It is calculated as:
F1 = 2 × (Precision × Recall) / (Precision + Recall)
It can be useful when both false positives and false negatives matter.
14. Can a confusion matrix be used for multiclass classification?
Yes. A confusion matrix can be extended to classification problems with more than two classes. Each row and column represents a class, allowing you to see which categories the model commonly confuses.
15. What does the diagonal of a confusion matrix represent?
The diagonal generally represents correct predictions because the predicted class matches the actual class. A strong classifier will often have relatively large values along the diagonal compared with its off-diagonal errors.
16. Why is a confusion matrix important in machine learning?
It helps developers understand not only how often a model is wrong but also how it is wrong. This information can reveal class-specific weaknesses that a single accuracy score may hide.
17. When should you use a confusion matrix?
A confusion matrix is primarily useful for classification models, including binary and multiclass classifiers. It can be especially valuable when the consequences of false positives and false negatives differ.
18. How does class imbalance affect a confusion matrix?
When one class is much more common than another, accuracy can appear high even when the model performs poorly on the minority class. Examining the confusion matrix along with precision, recall, F1 score, and class-specific metrics provides a more complete evaluation.
19. Can a confusion matrix help improve a machine learning model?
Yes. By identifying the classes and error types where a model performs poorly, developers can investigate potential causes such as insufficient training data, overlapping classes, inappropriate features, or an unsuitable classification threshold.
20. What is an example of a confusion matrix in real-world AI?
Suppose a healthcare model predicts whether a patient has a particular condition. True Positives are patients correctly identified as having the condition, True Negatives are patients correctly identified as not having it, False Positives are patients incorrectly flagged, and False Negatives are patients with the condition whom the model fails to identify.
Related Articles
View AllData Science
Power BI and Business Intelligence Careers: Trends to Watch in 2026
Power BI and BI careers remain strong in 2026, but skills are shifting toward AI, governance, cloud platforms, semantic layers, and decision automation.
Data Science
Power BI Resume Tips: How to Showcase BI Skills and Get Hired Faster
Practical Power BI resume tips for ATS formatting, BI skills, quantified achievements, certifications, portfolios, and LinkedIn updates that help you get hired faster.
Data Science
Best Power BI Projects for Beginners to Practice Data Analytics Skills
Practice Power BI with beginner-friendly projects in sales, churn, HR, finance, operations, DAX, and publishing using realistic business data.
Trending Articles
The Role of Blockchain in Ethical AI Development
How blockchain technology is being used to promote transparency and accountability in artificial intelligence systems.
AWS Career Roadmap
A step-by-step guide to building a successful career in Amazon Web Services cloud computing.
Top 5 DeFi Platforms
Explore the leading decentralized finance platforms and what makes each one unique in the evolving DeFi landscape.