

How to Transition from Non-Tech to Data Science: A 90-Day Learning and Portfolio Plan
 Suyash Raizada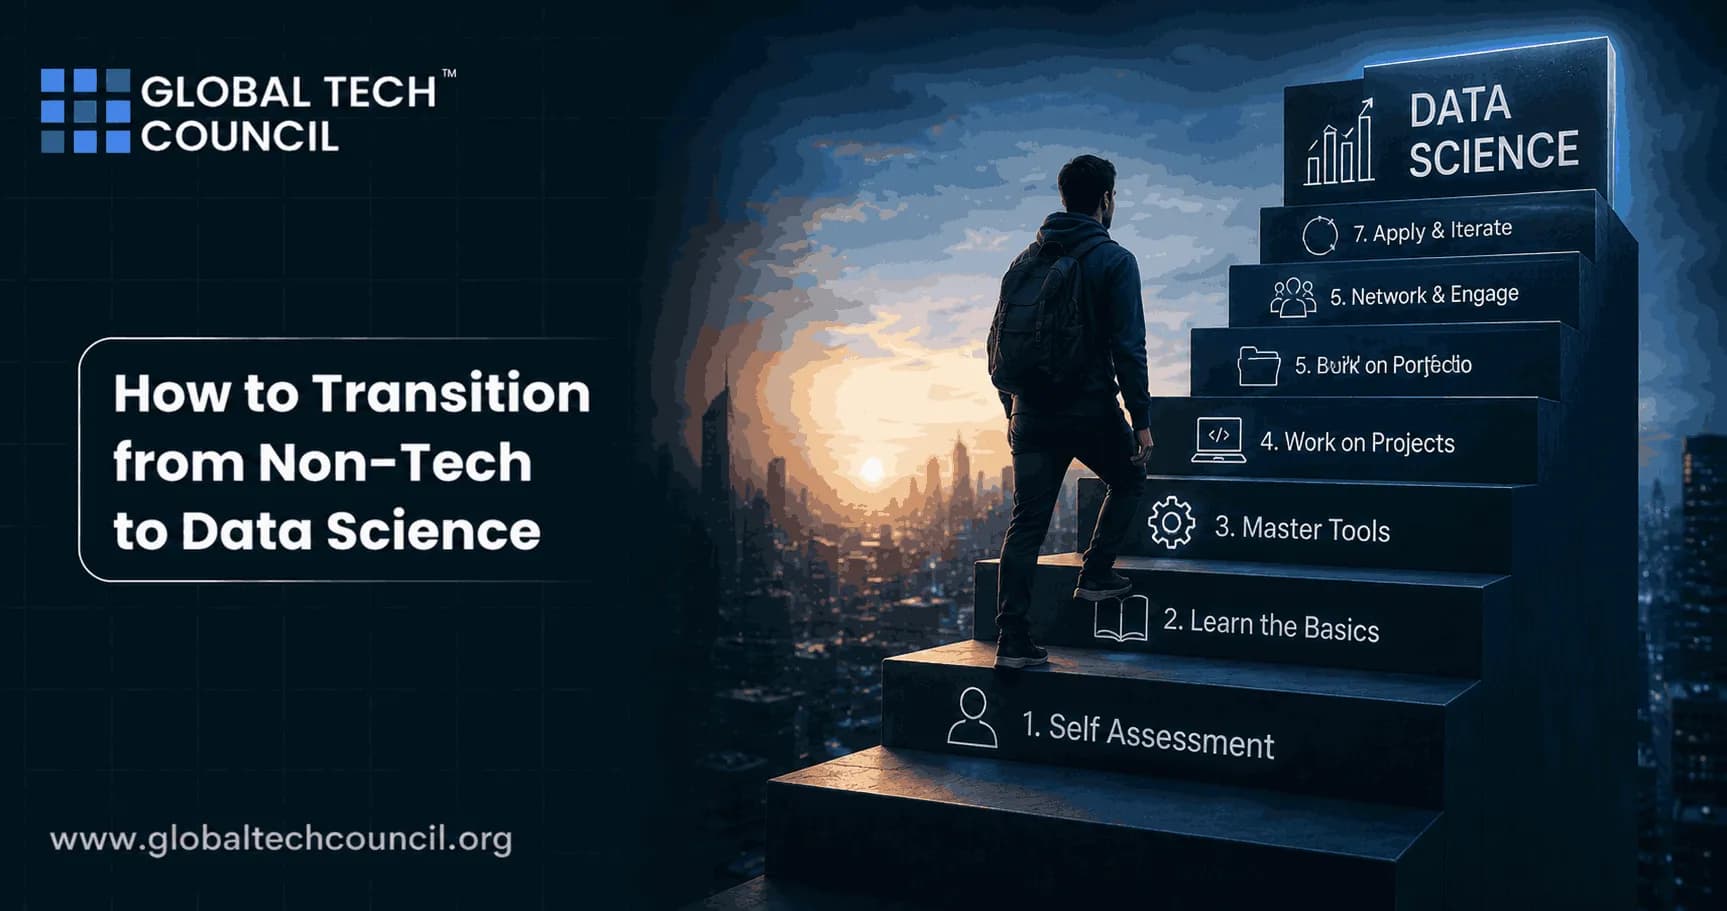
How to transition from non-tech to data science in 90 days is less about cramming every algorithm and more about building job-ready evidence. A realistic plan prioritizes three outcomes: foundational literacy in Python, SQL, statistics, and data handling; two to three portfolio projects using real datasets; and business-relevant insight generation, not just model training. Entry-level hiring has also shifted toward hybrid analytics expectations, where SQL, dashboards, and clear communication often matter as much as beginner machine learning.
This 90-day learning and portfolio plan is designed for career switchers balancing a full-time job. It uses a steady daily commitment and emphasizes deliverables you can show to recruiters and hiring managers.

What Data Science Roles Actually Expect from Career Switchers
Many non-tech professionals assume they must master advanced machine learning before applying. In practice, early-career roles often reward candidates who can:
Frame a business question and define success metrics
Extract and prepare data using SQL, spreadsheets, or Python
Explain insights clearly with charts, dashboards, and concise narratives
Use basic models appropriately (regression, classification) and evaluate them honestly
This is why a 90-day transition plan works best when it starts with analytics foundations and then adds light modeling. For many candidates, the first role is more likely to be data analyst, BI analyst, reporting analyst, or junior analytics engineer - and deeper data science specialization follows from there.
Tools and Skills to Prioritize in a 90-Day Plan
To keep your learning portfolio-friendly and aligned with common job requirements, focus on a practical stack:
Python: core syntax, then pandas for analysis
SQL: querying, joins, grouping, and basic data modeling concepts
Statistics: descriptive stats, probability basics, and interpretation
Visualization: matplotlib and seaborn, plus optional BI tooling
Notebooks and versioning: Jupyter Notebook and GitHub
Low-code tools like Power BI and Tableau can accelerate early wins for non-technical professionals, particularly for dashboard reporting. If you are targeting analytics-heavy roles, pairing SQL with a dashboard project can be as valuable as a beginner machine learning notebook.
Time Commitment: Consistency Beats Intensity
Compressed transition plans sometimes assume very high daily study hours, but most career switchers do better with a sustainable baseline. Aim for 1.5 to 2 hours per day on weekdays and a longer project block on weekends. The key is weekly output: solved exercises, a cleaned dataset, a finished chart, a written insight summary, or a published notebook.
Days 1-30: Foundations (Python, SQL, Statistics, and Workflow)
The goal of the first month is to build literacy and reduce friction. You want to feel comfortable opening a dataset, asking basic questions, writing simple queries, and documenting your steps.
Learning Objectives
Python basics: variables, data types, conditionals, loops, functions
Statistics basics: mean, median, variance, standard deviation, simple probability
SQL fundamentals: SELECT, WHERE, GROUP BY, ORDER BY, JOIN
Reproducible workflow: Jupyter Notebook structure, clear markdown notes, saving outputs
Weekly Structure (Suggested)
Week 1: Python fundamentals and small coding drills
Week 2: SQL basics with real tables (sample retail or HR schema)
Week 3: Statistics basics and interpreting charts
Week 4: Combine Python, basic stats, and simple charts in a single notebook
Mini-Project Deliverable (End of Month)
Complete one mini-project that demonstrates exploration, not perfection. A suitable example is a basic exploratory data analysis of a public dataset (sales, customer reviews, or operations metrics) that includes:
a short problem statement
basic cleaning (handling missing values and duplicates)
three to five charts
three written insights in plain language
If you want structured fundamentals, consider a Python certification path, a SQL certification, or a Statistics for Data Science course from Global Tech Council.
Days 31-60: Data Analysis, Cleaning, and Visualization (Portfolio Project 1)
Month two is where your transition becomes visible. Employers want proof that you can take messy data and produce something decision-ready.
Learning Objectives
pandas: reading files, filtering, joins and merges, groupby, pivot tables
NumPy: arrays, vectorized operations, basic numerical manipulation
Visualization: matplotlib and seaborn for clear, labeled charts
Data quality basics: missing values, outliers, inconsistent categories, date parsing
Portfolio Project 1: Insight-First Analysis
Choose a business-relevant use case that mirrors real work. Strong starter options include sales analysis, operational performance tracking, or dashboard-style reporting.
Recommended project format (keep it simple and readable):
Business question: What decision should this analysis support?
Dataset and context: What is in the data and what is missing?
Cleaning decisions: What you changed and why
EDA and visuals: trends, segments, seasonality, and distribution checks
Insights and recommendations: three to seven bullet points tied to metrics
Add Communication Artifacts
Career switchers stand out by writing clearly. Include:
a 150 to 250 word executive summary at the top of the notebook
chart titles that state the takeaway directly
a short section called Limitations explaining data constraints and assumptions
A Data Analytics certification, Power BI training, or Tableau training from Global Tech Council can complement your Python and SQL work if you are targeting BI and analytics roles.
Days 61-90: Machine Learning Basics and Portfolio Packaging (Projects 2-3)
Month three introduces machine learning in a controlled way. The focus is on fundamentals, evaluation, and knowing when models are appropriate. The goal is not to present yourself as a research scientist, but to demonstrate that you can use models responsibly and explain results in plain terms.
Learning Objectives
Core ML workflow: train-test split, overfitting, baseline models
Beginner models: linear regression, logistic regression, decision trees
Evaluation metrics: RMSE and MAE for regression; accuracy, precision, and recall for classification
Feature thinking: encoding categories, scaling when needed, leakage awareness
Portfolio Project 2: SQL-First Analysis (Analytics Credibility)
Build a project where SQL does the heavy lifting and Python is optional. Example deliverables:
five to ten well-commented SQL queries
a small data dictionary
a summary of findings and recommended actions
Portfolio Project 3 (Capstone): End-to-End Notebook with a Light Model
Choose a dataset where a simple model adds genuine value. Examples that work well for beginners:
Sales forecasting or demand estimation with linear regression (with clear caveats)
Churn or conversion prediction with logistic regression
Customer segmentation using descriptive analysis or clustering, paired with business personas
Capstone checklist:
Clear problem statement and success metric
Cleaned dataset saved as a reproducible output
Exploratory analysis and supporting visuals
Baseline model and at least one improvement iteration
Interpretation tied back to business decisions
Recommendations and next steps
For a structured machine learning foundation, consider a Machine Learning certification from Global Tech Council, paired with a Data Science certification for end-to-end coverage.
Professionals looking to bridge technical expertise with business impact may also benefit from a Marketing Certification, which helps develop skills in customer insights, digital strategy, and growth planning, while an AI Certification provides deeper knowledge of AI technologies, model deployment, governance, and real-world implementation across industries.
What a Strong Beginner Portfolio Should Include (and What to Avoid)
Include These Essentials
Two to three distinct projects solving different business problems
At least one SQL project and one Python analysis project
Documentation: problem, data source, method, findings, and recommendations
Stakeholder-friendly visuals with readable labels and short takeaways
Evidence of trade-offs: why you removed outliers, how you handled missing data
Avoid Common Pitfalls
Copying a tutorial end-to-end without adding your own question or interpretation
Overemphasizing model accuracy while ignoring data quality and business meaning
Publishing notebooks with no narrative, no conclusion, and no next steps
How to Position Your Resume and LinkedIn After 90 Days
Your story should connect your prior domain experience to measurable outcomes. Use a simple structure:
Headline: "Operations professional transitioning to data analytics and data science"
Skills: SQL, Python (pandas), statistics, visualization, Power BI or Tableau
Projects: two to three bullets each focusing on business impact and methods used
Example bullet format: "Analyzed 50,000 transaction records using SQL and pandas; identified the top three drivers of product returns and recommended policy changes projected to reduce the return rate."
Conclusion: A Realistic 90-Day Transition Is Portfolio-Driven
Transitioning from a non-technical background to data science in 90 days comes down to building proof. Focus on foundational literacy, then complete two to three projects that demonstrate the full pipeline: question definition, data cleaning, analysis, visualization, and recommendations. Add beginner machine learning only after you can reliably generate insights from messy data.
With consistent daily practice and clean, well-explained work published to GitHub, you will be positioned for analytics and junior data roles that align with current entry-level expectations - and you will have a clear path toward deeper data science specialization.
FAQs
1. Why Are Many Professionals Transitioning from Non-Tech Roles to Data Science?
Data science offers strong career growth, competitive salaries, and opportunities to solve business problems using data-driven insights across various industries.
2. Can Someone Without a Technical Background Become a Data Scientist?
Yes, individuals from fields such as marketing, finance, healthcare, education, and operations can successfully transition into data science with structured learning and practical experience.
3. What Skills Should Be Learned During the First 30 Days?
The first 30 days should focus on foundational concepts, including statistics, data literacy, Python programming, spreadsheets, and basic data analysis techniques.
4. Why Is Python Important for Aspiring Data Scientists?
Python is widely used for data analysis, machine learning, automation, visualization, and working with large datasets, making it a core skill for data science roles.
5. What Statistics Topics Should Be Prioritized in the First Month?
Learners should focus on descriptive statistics, probability, distributions, hypothesis testing, correlation, and basic inferential statistics.
6. When Should SQL Be Introduced in the 90-Day Plan?
SQL should be introduced during the first month and strengthened during the second month because it is essential for querying, managing, and analyzing data stored in databases.
7. What Should Be Learned During Days 31-60?
The second phase should focus on data cleaning, exploratory data analysis (EDA), data visualization, SQL proficiency, and working with real-world datasets.
8. Why Is Data Visualization Important in Data Science?
Data visualization helps communicate insights effectively and allows stakeholders to understand trends, patterns, and recommendations more easily.
9. Which Data Visualization Tools Should Beginners Learn?
Popular tools include Matplotlib, Seaborn, Plotly, Tableau, Power BI, and Python-based visualization libraries.
10. What Types of Projects Should Be Included in a Beginner Portfolio?
Projects can include sales analysis, customer segmentation, market research, churn prediction, data dashboards, forecasting models, and business intelligence case studies.
11. How Many Portfolio Projects Should Be Completed Within 90 Days?
A strong beginner portfolio typically includes three to five well-documented projects that demonstrate analytical thinking and practical problem-solving skills.
12. What Should Be Learned During Days 61-90?
The final phase should focus on machine learning fundamentals, portfolio development, project documentation, interview preparation, and personal branding.
13. Which Machine Learning Concepts Are Most Important for Beginners?
Beginners should learn supervised learning, regression, classification, model evaluation, feature engineering, and basic machine learning workflows.
14. How Can Non-Tech Professionals Leverage Their Existing Experience?
Domain expertise from previous careers can provide valuable business context, helping candidates solve industry-specific problems and stand out from other applicants.
15. What Should a Data Science Portfolio Include Besides Projects?
A portfolio should include project summaries, methodologies, visualizations, code repositories, business insights, and clear explanations of outcomes and impact.
16. How Important Is GitHub for Aspiring Data Scientists?
GitHub is important because it showcases coding skills, project organization, collaboration practices, and technical proficiency to potential employers.
17. What Common Mistakes Should Career Changers Avoid?
Common mistakes include focusing only on theory, skipping hands-on projects, learning too many tools at once, neglecting statistics, and waiting until they feel “fully ready” before applying. Human beings have an impressive ability to spend six months preparing to start the thing they could have started today.
18. How Can Learners Build a Professional Network During the Transition?
They can join data science communities, attend webinars, participate in online forums, connect with professionals on LinkedIn, and contribute to open-source projects.
19. How Should Job Applications Be Approached After the 90-Day Plan?
Candidates should tailor resumes to highlight transferable skills, showcase portfolio projects, emphasize business problem-solving abilities, and apply consistently to relevant roles.
20. What Results Can Be Expected After Following a 90-Day Learning and Portfolio Plan?
By the end of 90 days, learners can develop foundational data science skills, complete a professional portfolio, gain confidence with analytical tools, and become competitive candidates for entry-level data analytics or junior data science opportunities.
Related Articles
View All
Career Advice
How to Build a Job-Winning Tech Portfolio on GitHub: Real Project Ideas for Beginners
Learn how to build a job-winning tech portfolio on GitHub with curated repos, strong READMEs, and beginner-friendly project ideas aligned to real roles.
Career Advice
From Junior to Senior Developer: Competencies, Metrics, and Habits Hiring Managers Look For
Learn what hiring managers expect as developers move from junior to senior, including core competencies, measurable impact metrics, and daily habits that signal senior readiness.
Career Advice
Negotiating Your First Tech Offer: Salary, Equity, Remote Work, and Benefits (With Scripts)
Learn how to negotiate your first tech offer with data-driven tactics and scripts for salary, equity, remote work, and benefits, plus what to get in writing.
Trending Articles
The Role of Blockchain in Ethical AI Development
How blockchain technology is being used to promote transparency and accountability in artificial intelligence systems.
AWS Career Roadmap
A step-by-step guide to building a successful career in Amazon Web Services cloud computing.
Top 5 DeFi Platforms
Explore the leading decentralized finance platforms and what makes each one unique in the evolving DeFi landscape.