

How to Debug Java Code: Tools, Techniques, and Practical Tips
 Suyash Raizada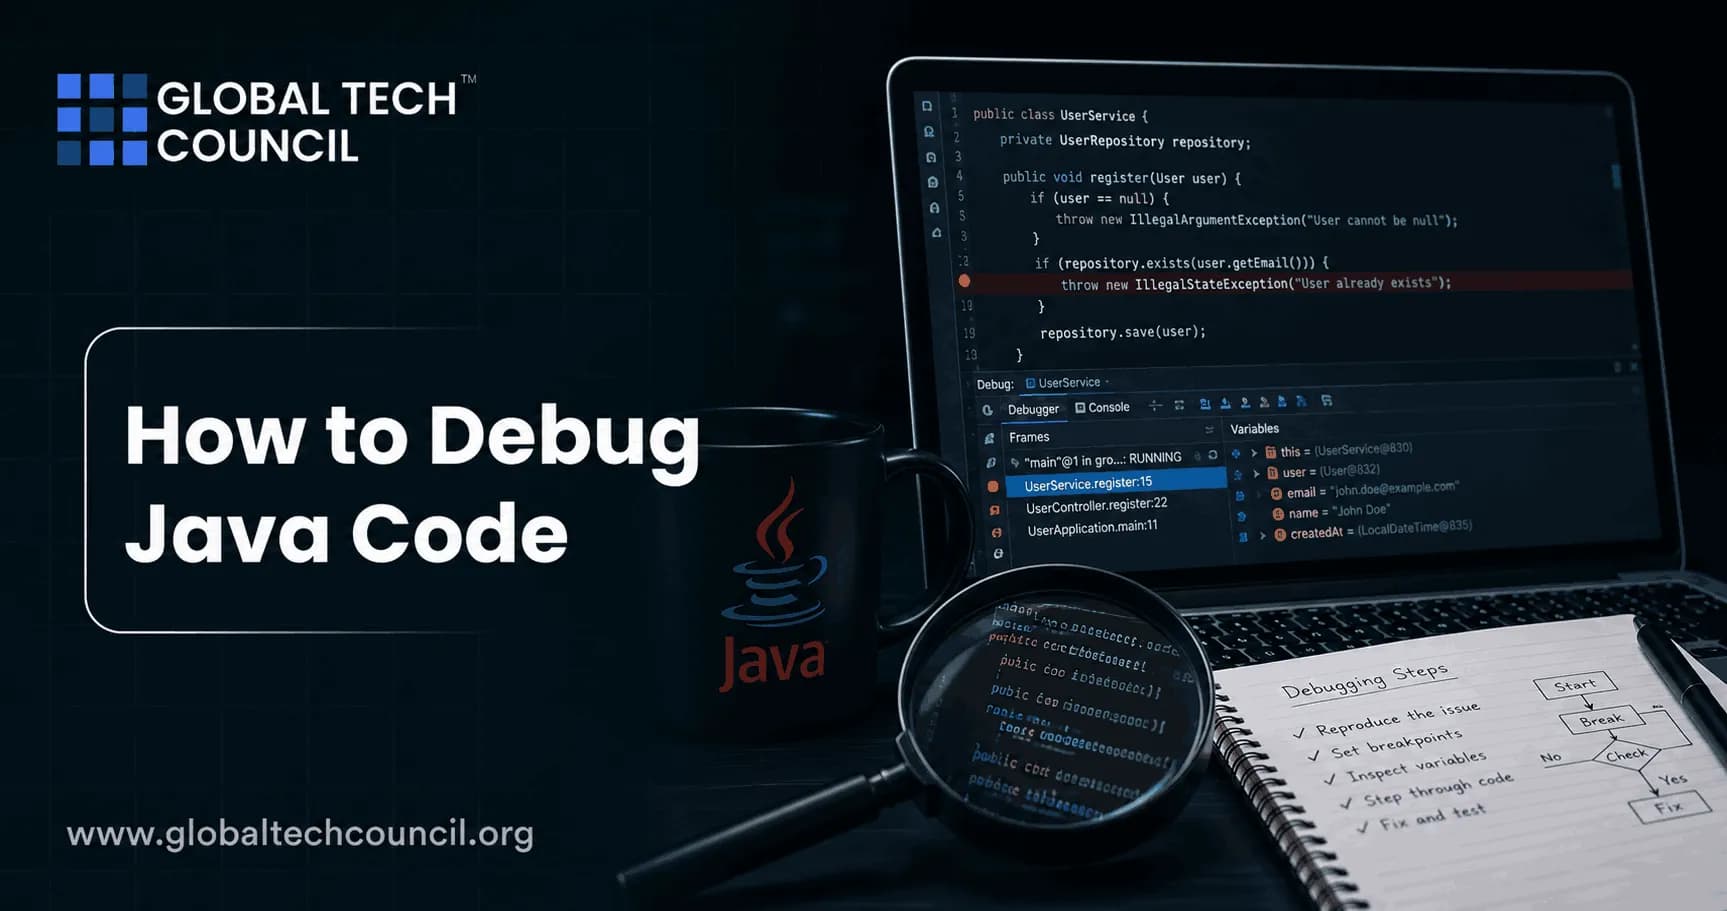
Debug Java code by starting with evidence: reproduce the failure, read the full stack trace, inspect runtime state in your IDE, add structured logs, then verify the fix with tests. That sounds basic. It is also how experienced Java engineers avoid guessing their way through production incidents.
Modern Java debugging is not only about breakpoints. You will use IntelliJ IDEA, Eclipse, NetBeans, Visual Studio Code, jdb, VisualVM, JConsole, log frameworks, profilers, and sometimes production-safe tools such as Raygun, Rookout, or BrowserStack. The right tool depends on where the bug lives: local code, threads, memory, HTTP traffic, a browser matrix, or a running cloud service. Debugging is a critical skill that enables Java developers to identify issues, optimize application performance, and build reliable software. Pursuing a Tech Certification helps professionals strengthen their expertise in Java programming, debugging techniques, IDE tools, backend development, software testing, and enterprise application design. These industry-recognized certifications provide practical experience in diagnosing complex issues, improving code quality, and developing production-ready Java applications using modern development practices.

Start With a Repeatable Java Debugging Workflow
Do not open the debugger first. Open the evidence first. A repeatable workflow saves hours, especially when the issue is intermittent or hidden behind several service calls.
Define the symptom: Write down the exact error, input, user action, environment, Java version, and deployment version.
Reproduce it: Create a test, script, API call, or UI path that triggers the failure on demand.
Read the stack trace fully: The first application-owned line is often more useful than the top framework line.
Inspect state: Use breakpoints, watches, thread views, heap views, or logs.
Form one hypothesis: Change one thing. Test it. Do not fix five suspects at once.
Verify with automated tests: Add a unit, integration, or regression test before closing the bug.
A real example: a Java 17 service once failed with java.lang.NullPointerException: Cannot invoke "com.acme.Cart.total()" because "cart" is null. Older Java versions often gave a less helpful null pointer message. Since helpful NullPointerExceptions became standard in Java 14, the JVM can point you closer to the null reference. Still, the fix was not "add a null check everywhere". The correct fix was to find why the deserializer skipped the cart field for one old mobile client payload.
Use IDE Debuggers for Local Java Bugs
If you write Java professionally, learn your IDE debugger well. Print statements are fine for quick checks, but they are a poor substitute for inspecting call stacks, object graphs, and live thread state.
IntelliJ IDEA
IntelliJ IDEA is strong for everyday debugging. Use conditional breakpoints when a loop fails only on the 42,000th record, but do not scatter them carelessly. Conditional breakpoints evaluate expressions repeatedly, so they can slow hot code. For tight loops, I often add a temporary if block and place a normal breakpoint inside it. It is less elegant. It is faster.
Useful IntelliJ habits:
Run to Cursor: Jump to a line without creating another breakpoint.
Evaluate Expression: Test a method call or condition at the paused line.
Thread view: Switch between threads when debugging race conditions.
Run tests until failure: Useful for flaky concurrency tests.
Eclipse, NetBeans, and Visual Studio Code
Eclipse and NetBeans both support breakpoints, step into, step over, step return, variable inspection, expression evaluation, and thread control. They remain useful in enterprise Java shops, especially where older projects already use Eclipse workspace conventions.
Visual Studio Code becomes a capable Java debugging setup with the Debugger for Java extension from Microsoft. It supports local and remote debugging, plus hot code replacement for some code changes. That last part matters when you are iterating on a Spring Boot service and do not want a full restart after every small edit.
Know the JVM Tools: jdb, JConsole, and VisualVM
The Java Debugger, known as jdb, ships with the JDK. It is not as friendly as an IDE, but it is useful on servers, containers, and restricted environments. You can set breakpoints, list threads, print object values, and evaluate expressions from the command line.
For runtime behavior, use JConsole and VisualVM. JConsole exposes JMX data such as memory pools, threads, classes, and MBeans. VisualVM is useful for CPU sampling, heap inspection, thread dumps, and spotting excessive object creation. VisualVM is distributed separately for current JDK workflows, so install it intentionally rather than assuming it is always present.
When a service becomes slow after 30 minutes, do not stare at source code first. Check heap usage, garbage collection pressure, blocked threads, and database connection pool metrics. Many "logic bugs" are resource bugs wearing a fake mustache. As software systems become increasingly intelligent and interconnected, debugging extends beyond finding syntax errors to understanding complex interactions across cloud platforms, AI services, distributed applications, and automation workflows. Becoming a Deeptech Expert equips professionals with interdisciplinary knowledge of emerging technologies, helping them analyze system behavior, troubleshoot performance bottlenecks, and optimize applications operating in dynamic, technology-driven environments. This broader perspective enables developers to solve complex problems more effectively while building resilient, future-ready software.
Debug Java Code With Logging, Not Random Prints
System.out.println has one advantage: it is quick. After that, it loses. In real projects, use Log4j 2, Logback, or the logging setup already chosen by your framework. Logging gives you levels, appenders, JSON output, rolling files, MDC context, and configuration without recompiling.
Good Java logs answer four questions:
What happened? Include the action, not just "failed here".
Which request? Add a request ID or correlation ID through MDC.
Which user or tenant? Log identifiers carefully, without leaking secrets or personal data.
What changed? Include key state transitions and external response codes.
Be blunt with yourself: if your distributed system logs do not carry a correlation ID, production debugging will hurt. You will grep five services and still not know which payment attempt matched which inventory reservation.
Read Stack Traces Like an Engineer
A Java stack trace is a timeline in reverse. The top line shows where the exception surfaced. The useful line is often the first class your team owns.
Look for:
Exception type: NullPointerException, IllegalArgumentException, ConcurrentModificationException, SQLException, TimeoutException, and so on.
Application frames: Your package names matter more than framework plumbing.
Caused by: The root cause may sit lower in the trace.
Suppressed exceptions: Common with try-with-resources and failed close operations.
If you see java.util.ConcurrentModificationException, do not assume Java collections are broken. You probably changed a collection while iterating it, or one thread modified it while another thread was reading it. The fix might be using an Iterator removal method, copying the collection first, or choosing a concurrent collection such as ConcurrentHashMap. Pick based on access pattern, not hope.
Advanced Java Debugging: Threads, Memory, and Performance
Debugging Multithreaded Code
Concurrency bugs rarely obey you. They disappear when you add logging, then return under load. Use thread dumps, IDE thread views, and repeated test runs. In IntelliJ IDEA or Eclipse, pause all threads when needed, but remember that stopping a thread can change timing.
For deadlocks, capture a thread dump. JConsole and VisualVM can show blocked threads and monitor ownership. In production, tools such as jstack are often enough to prove that one thread holds lock A and waits for lock B while another does the reverse.
Finding Memory Leaks
Java memory leaks usually mean unwanted references, not forgotten free calls. Watch for static collections, caches without eviction, listeners never removed, and ThreadLocal values left behind in thread pools.
Use VisualVM or another profiler to compare heap snapshots before and after a workload. If one class count keeps climbing and never drops after garbage collection, follow its reference path. That path usually tells the story.
Profiling Before Optimizing
Do not optimize code because it looks slow. Profile it. CPU sampling can show that your expensive method is not the real bottleneck, while a logging pattern, JSON serialization step, or database call is burning the time.
Production Debugging and Observability
Interactive breakpoints are dangerous in production. Pausing a live payment service or order API can create a bigger incident than the original bug.
For production Java debugging, use safer methods:
Error monitoring: Raygun can group errors and show context such as breadcrumbs and custom tags.
Live data collection: Rookout focuses on collecting runtime data without stopping the application.
Cross-device testing: BrowserStack helps reproduce browser and device-specific issues in Java-backed web applications.
Centralized logs and traces: Pair application logs with metrics and distributed traces when debugging microservices.
This is where debugging overlaps with observability. Logs tell you what the code said. Metrics tell you how the system behaved. Traces show where time went across service boundaries. You need all three for serious cloud deployments. Reliable software plays a significant role in customer satisfaction, product quality, and brand reputation. Earning a Marketing Certification helps professionals understand how application reliability, user experience, customer feedback, and product quality influence business success. These skills enable developers to recognize how delivering stable, well-tested software contributes to stronger customer trust, improved product adoption, and long-term organizational growth.
Practical Tips That Prevent Debugging Pain
Read the full error before editing code. Many bugs are explained by the message you skipped.
Use small tests to isolate behavior. A five-line JUnit test beats clicking through a UI twenty times.
Name variables clearly. Debugging data2 and tmpObj is self-inflicted damage.
Watch loop boundaries. Off-by-one errors still break production code.
Check defaults. Time zones, character encoding, connection timeouts, and locale settings cause ugly Java bugs.
Do not swallow exceptions. Empty catch blocks hide root causes.
Document strange fixes. Future you will not remember why that guard clause exists.
Build Debugging Skill Through Practice
Debugging is a craft skill. You improve by investigating real failures, not by memorizing IDE buttons. If you are building a structured learning path, connect this topic with Global Tech Council's programming certifications and Java-focused training resources. Pair Java debugging with courses in software testing, cloud deployment, cybersecurity, and data engineering when your role touches production systems.
Your next step is simple: take one existing Java project, add structured logging with request IDs, write one failing JUnit test for a known bug, then debug it using your IDE and VisualVM. Do that once carefully. You will learn more than you would from another hour of random print statements.
FAQs
1. What Is Java Debugging?
Java debugging is the process of identifying, analyzing, and fixing errors, bugs, and unexpected behavior in Java applications. It helps developers improve code quality, application performance, and software reliability.
2. Why Is Debugging Important in Java Development?
Debugging helps developers detect logical errors, runtime exceptions, performance bottlenecks, and incorrect program behavior before software is deployed, resulting in more stable and maintainable applications.
3. What Are the Most Common Types of Java Bugs?
Common Java bugs include syntax errors, logical errors, runtime exceptions, null pointer exceptions, array index errors, memory leaks, concurrency issues, and performance-related problems.
4. Which Tools Are Best for Debugging Java Code?
Popular Java debugging tools include IntelliJ IDEA, Eclipse, Visual Studio Code, Java Debugger (JDB), VisualVM, Java Flight Recorder (JFR), JConsole, and logging frameworks such as Log4j and SLF4J.
5. How Do Breakpoints Work in Java Debugging?
Breakpoints pause program execution at specific lines of code, allowing developers to inspect variables, evaluate expressions, analyze program flow, and identify the root cause of issues before continuing execution.
6. What Is Step-by-Step Debugging in Java?
Step-by-step debugging allows developers to execute code one statement at a time using commands such as Step Into, Step Over, and Step Out, making it easier to understand application behavior and locate bugs.
7. How Can Developers Debug NullPointerException in Java?
Developers should review stack traces, identify null object references, validate object initialization, add null checks where appropriate, and use debugger tools to inspect variable values during execution.
8. What Is a Stack Trace in Java?
A stack trace is a detailed report showing the sequence of method calls leading to an exception. It helps developers locate the exact file, method, and line number where an error occurred.
9. How Does Logging Help Debug Java Applications?
Logging records application events, errors, warnings, and execution details, making it easier to diagnose issues in development, testing, and production environments without interrupting application execution.
10. What Are the Best Logging Frameworks for Java?
Common logging frameworks include Log4j, Logback, SLF4J, and Java Util Logging (JUL). These frameworks help developers monitor application behavior, troubleshoot issues, and maintain production systems.
11. How Can Developers Debug Multithreaded Java Applications?
Developers can use thread dumps, VisualVM, Java Flight Recorder, IDE debugging tools, and thread analysis utilities to identify race conditions, deadlocks, synchronization problems, and performance bottlenecks.
12. What Are the Best Practices for Debugging Java Code?
Best practices include reproducing issues consistently, using breakpoints effectively, reading stack traces carefully, writing meaningful logs, testing fixes thoroughly, isolating bugs, and validating solutions before deployment.
13. What Common Debugging Mistakes Should Java Developers Avoid?
Developers should avoid ignoring compiler warnings, relying only on print statements, skipping log analysis, modifying multiple code sections simultaneously, overlooking exception messages, and failing to reproduce bugs consistently.
14. How Can Unit Testing Reduce Debugging Time?
Unit tests identify issues early by verifying individual components before integration. They help developers detect regressions, validate fixes, and reduce debugging effort throughout the software development lifecycle.
15. Which Java Applications Require Advanced Debugging Techniques?
Enterprise applications, microservices, REST APIs, cloud-native applications, financial systems, Android applications, distributed systems, and high-performance backend services often require advanced debugging approaches.
16. What Skills Should Developers Learn Alongside Java Debugging?
Developers should strengthen exception handling, object-oriented programming, multithreading, logging frameworks, JVM fundamentals, unit testing, performance optimization, Spring Boot, Git, and software architecture.
17. How Can Beginners Improve Their Java Debugging Skills?
Beginners should practice reading stack traces, using IDE debuggers, writing unit tests, analyzing logs, solving coding problems, debugging sample applications, and learning common Java exceptions through hands-on projects.
18. Is Debugging an Important Skill for Java Interviews?
Yes. Many Java interviews assess debugging ability through coding exercises, bug-fixing challenges, exception analysis, code reviews, and troubleshooting scenarios to evaluate practical problem-solving skills.
19. How Is AI Changing Java Debugging in 2026?
AI-powered development tools now assist developers by identifying bugs, suggesting code fixes, explaining exceptions, optimizing performance, generating test cases, and accelerating root cause analysis while still requiring human validation.
20. Why Should Every Java Developer Master Debugging Techniques?
Debugging is an essential skill for building reliable, secure, and maintainable Java applications. By mastering debugging tools, breakpoints, stack traces, logging frameworks, testing strategies, and performance analysis, Java developers can solve problems faster, improve software quality, and become more effective in enterprise software development and technical interviews.
Related Articles
View All
Java
Future of Java Development: AI Tools, Cloud-Native Apps, and Emerging Trends
Explore the future of Java development through AI coding tools, cloud-native apps, serverless systems, agentic architecture, and skills Java developers need next.

Java
Exception Handling in Java: Best Practices for Cleaner and Safer Code
Learn exception handling in Java with practical best practices for specific exceptions, try-with-resources, secure logging, propagation, and safer APIs.

Java
Best Java IDEs for Developers: Eclipse, IntelliJ IDEA, and VS Code Compared
Compare the best Java IDEs for developers: IntelliJ IDEA, Eclipse, and VS Code. See strengths, trade-offs, use cases, and which tool fits your workflow.
Trending Articles
The Role of Blockchain in Ethical AI Development
How blockchain technology is being used to promote transparency and accountability in artificial intelligence systems.
AWS Career Roadmap
A step-by-step guide to building a successful career in Amazon Web Services cloud computing.
Top 5 DeFi Platforms
Explore the leading decentralized finance platforms and what makes each one unique in the evolving DeFi landscape.