

Random Forest Explained: Ensemble Learning for Better Predictions
 Suyash Raizada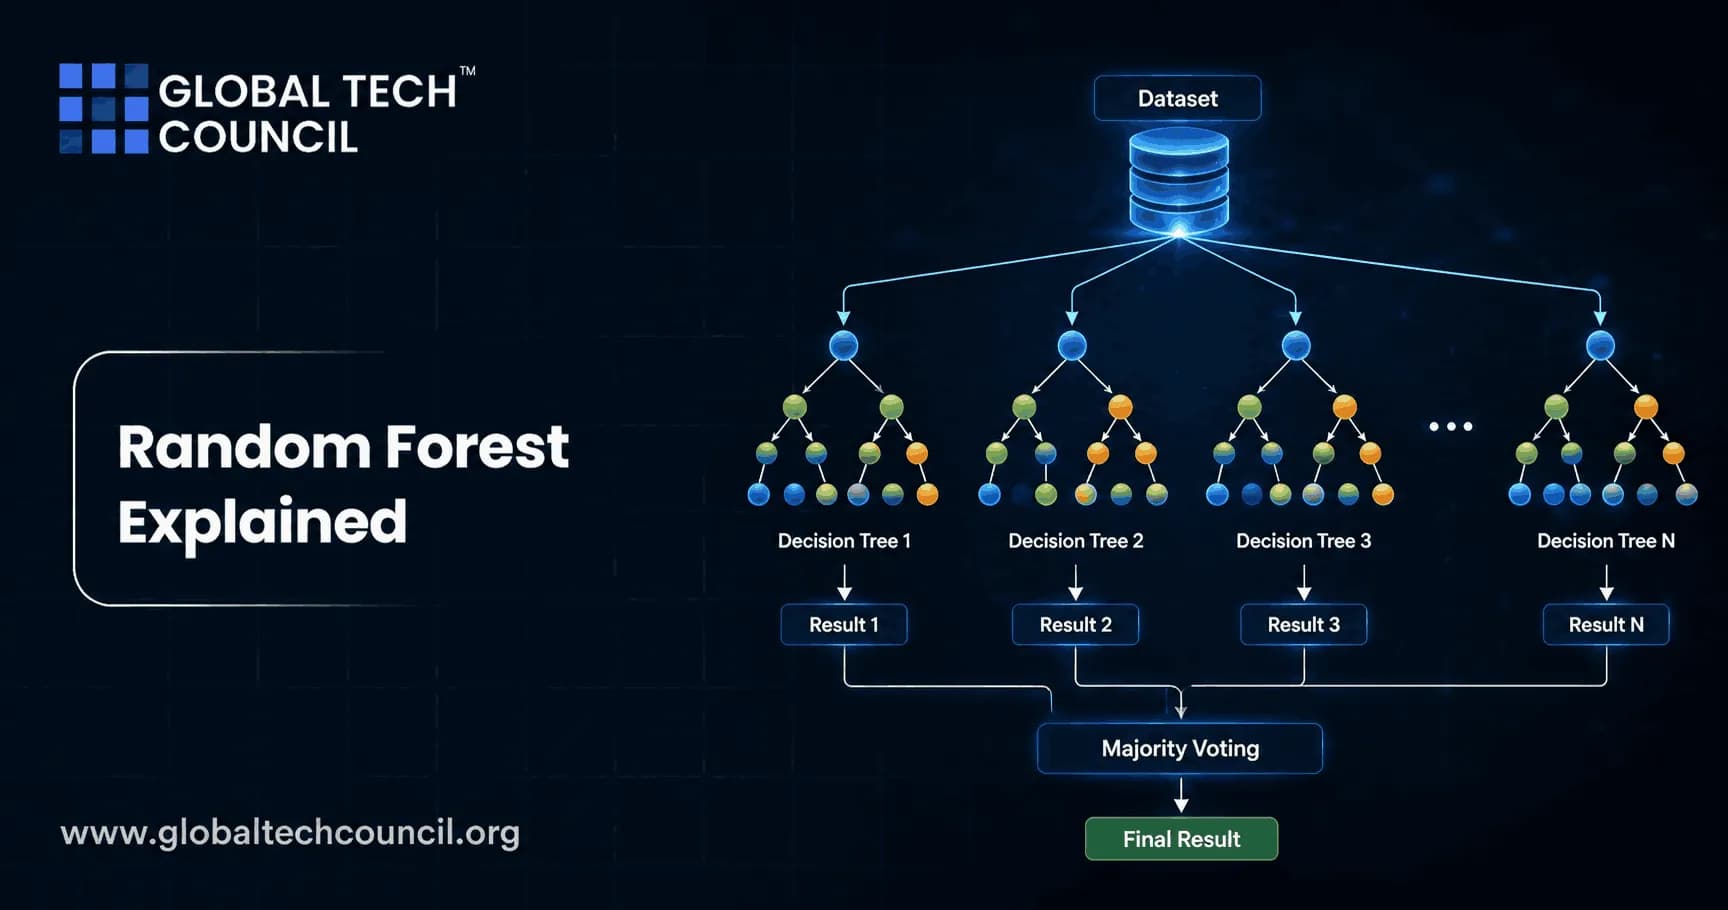
Random Forest is one of the first algorithms you should try when you have structured data and need dependable predictions without building a deep learning system. It trains many decision trees, adds controlled randomness, then combines their answers. Simple idea. Strong results.
For developers and data professionals, Random Forest stays useful because it works well for classification and regression, handles nonlinear patterns, and gives you practical diagnostics such as feature importance. It is not the newest model in machine learning, but it is still a serious baseline in finance, healthcare, customer analytics, smart city projects, and industrial prediction.

Learning how and when to use Random Forest is an important milestone for anyone building practical machine learning skills. A Certified Machine Learning Expert credential helps professionals strengthen their understanding of supervised learning, ensemble methods, feature engineering, and model evaluation, making it easier to apply algorithms like Random Forest to real-world business challenges.
What Is Random Forest?
Random Forest is a supervised ensemble learning algorithm. Instead of training one decision tree, it trains many decision trees on slightly different versions of the data. Each tree makes a prediction, and the forest combines those predictions into one final result.
For classification, the model usually uses majority voting. If 700 out of 1,000 trees predict that a transaction is fraudulent, the final class is fraud. For regression, the model averages the numeric predictions from all trees, such as predicted house price, credit risk score, or expected demand.
The two main ideas are:
Bootstrap sampling: each tree is trained on a random sample of rows drawn with replacement from the training data.
Random feature selection: at each split, the tree only considers a random subset of features, not every feature.
That second detail matters. If every tree saw the same strongest feature at every split, the trees would look too similar. Random feature selection makes trees disagree more, and the average of many less-correlated trees is usually more stable than a single tree.
While Random Forest remains one of the most dependable algorithms for structured data, successful AI practitioners also need to understand how it compares with gradient boosting, deep learning, and other modern approaches. A Certified AI & Machine Learning Expert credential provides this broader perspective, helping professionals select the right techniques for different datasets, deployment requirements, and business objectives.
How Random Forest Works Step by Step
Create bootstrap datasets. The algorithm samples rows from the training set with replacement. Some rows appear multiple times, while others are left out.
Train a decision tree on each sample. Trees are usually grown deep, unless you restrict them with parameters such as max_depth or min_samples_leaf.
Randomly select candidate features at every split. In scikit-learn, RandomForestClassifier uses max_features='sqrt' by default for classification.
Aggregate predictions. Voting is used for classification. Averaging is used for regression.
Estimate performance. You can use a validation set, cross validation, or out-of-bag scoring.
A practitioner detail: in scikit-learn 1.1, the default value for max_features in random forest classifiers moved away from the old 'auto' behavior and settled on 'sqrt'. Old notebooks that hard-code max_features='auto' can throw warnings or break depending on the version. This is the kind of small library change that causes avoidable confusion in model training reviews.
Why Random Forest Often Beats a Single Decision Tree
A single decision tree is easy to explain, but it can be unstable. Change a few rows in the training data and the tree structure may shift sharply. That is high variance.
Random Forest reduces that variance. Each tree is noisy in its own way, but the combined model smooths out those errors. This is why Random Forest often performs better than one tree on tabular datasets with mixed numeric and categorical features.
Peer-reviewed studies on real-world city data have shown Random Forest outperforming models such as support vector machines, feedforward neural networks, k-nearest neighbors, naive Bayes, and bagged trees across metrics including accuracy, precision, recall, F-measure, specificity, and G-mean. The important part is not just one high score. The model performed well across balanced evaluation measures, which matters when class imbalance is present.
Random Forest for Classification and Regression
Classification Examples
Use Random Forest classification when your target is a category:
Fraudulent or legitimate transaction
Customer likely to churn or stay
Loan applicant likely to default or repay
Patient at high or low risk
Machine part likely to fail or continue operating
In banking, Random Forest models are often used for transaction screening and credit risk scoring. Some industry case discussions report online fraud reductions of around 30 percent after deploying tree-based risk models at scale. Treat numbers like that carefully, though. Fraud reduction depends heavily on data quality, threshold setting, investigation workflows, and false positive tolerance.
Regression Examples
Use Random Forest regression when your target is numeric:
Predicting delivery time
Estimating insurance claim cost
Forecasting product demand
Predicting equipment remaining useful life
Estimating real estate price
For tabular regression, Random Forest is a sensible first benchmark. If gradient boosting later beats it, fine. You still have a credible baseline and feature importance outputs to compare.
Key Hyperparameters You Should Tune
Random Forest works reasonably well with defaults, but do not stop there on a professional project. Tune the parameters that change bias, variance, and runtime.
n_estimators: number of trees. More trees usually reduce variance, but increase memory use and prediction time. Common starting points are 200, 500, and 1,000.
max_depth: maximum tree depth. Limiting depth can reduce overfitting and speed up inference.
min_samples_split: minimum samples required to split an internal node.
min_samples_leaf: minimum samples required in a leaf. This parameter quietly changes results. Raising it from 1 to 5 can improve generalization on noisy business data.
max_features: number of candidate features considered at each split. Lower values create more diverse trees.
class_weight: useful for imbalanced classification, such as fraud detection or rare disease screening.
Use cross validation or a time-aware validation split when data has dates. Do not randomly split customer events or transactions if future information can leak into training. That mistake looks great in a notebook and fails badly in production.
Feature Importance and Interpretability
Random Forest is easier to inspect than many black-box models, but it is not transparent in the same way as a small decision tree.
You can use:
Impurity-based feature importance: fast and built into many libraries, but it can favor high-cardinality features.
Permutation importance: more reliable in many cases because it measures the performance drop after shuffling one feature.
Partial dependence plots: useful for seeing the average effect of a feature.
SHAP values: helpful when you need local explanations for individual predictions.
For regulated use cases, such as lending or clinical risk scoring, keep documentation of training data, validation results, feature selection decisions, and known limitations. If a feature importance chart says postcode is highly predictive of credit risk, you need to check whether it is acting as a proxy for a protected attribute.
Strengths of Random Forest
Strong performance on tabular data: especially when features are mixed, noisy, and nonlinear.
Less sensitive to outliers than some linear models: tree splits are not pulled around the same way a mean-based model can be.
Works for classification and regression: one algorithm family covers many business problems.
Low preprocessing burden: scaling is usually not required for tree-based models.
Useful diagnostics: feature importance, out-of-bag scores, and error analysis are practical for teams.
Limitations You Should Not Ignore
Random Forest is not always the best choice.
It can be heavy: hundreds of deep trees consume memory and slow inference.
It is less interpretable than one tree: you trade simple explanations for better accuracy.
It is often beaten by gradient boosting: XGBoost, LightGBM, and CatBoost frequently win on structured prediction problems when tuned well.
It is not ideal for images, audio, or raw text: deep learning architectures usually fit those data types better.
It needs careful encoding: scikit-learn Random Forest models do not natively handle string categories. You must encode them first.
My practical view: use Random Forest as an early benchmark for tabular data. If you need top leaderboard performance, test gradient boosting next. If you need millisecond inference on a constrained device, consider a smaller model.
Best Practices for Building a Random Forest Model
Start with clean targets. Label errors hurt tree ensembles more than teams expect.
Split data correctly. Use stratified splits for imbalanced classification and time-based splits for temporal data.
Handle missing values deliberately. Some libraries support missing values better than others. In scikit-learn, check your version and estimator behavior instead of assuming automatic support.
Encode categorical variables. Use one-hot encoding for low-cardinality categories. For high-cardinality features, test target encoding carefully with leakage controls.
Tune for the metric that matters. Fraud detection may need recall at a fixed false positive rate, not plain accuracy.
Monitor the model after deployment. Track input drift, prediction drift, latency, and business outcomes.
Building production-ready machine learning systems requires expertise that extends beyond model training to include cloud platforms, software engineering, scalable infrastructure, and cybersecurity. A Deep Tech Certification helps professionals develop these advanced technical capabilities, enabling them to deploy secure, reliable, and enterprise-scale AI solutions with confidence.
Where Random Forest Fits in a Machine Learning Career Path
If you are preparing for machine learning roles, Random Forest is not optional knowledge. You should be able to explain bagging, feature randomness, majority voting, variance reduction, feature importance, and model validation without reading notes.
For internal learning paths, connect this topic with Global Tech Council training in machine learning, artificial intelligence, data science, and MLOps. Random Forest also pairs well with modules on Python, model evaluation, responsible AI, and data preprocessing. If you already know linear regression and logistic regression, learn decision trees next, then Random Forest, then gradient boosting.
Next Step: Build One and Break It
Take a real tabular dataset, train a Random Forest, and then change one thing at a time: n_estimators, max_depth, min_samples_leaf, and class_weight. Plot the metric changes. Inspect permutation importance. Then compare it with logistic regression and LightGBM.
That exercise will teach you more than memorizing definitions. If your goal is certification, use it as a portfolio project while you work through Global Tech Council machine learning or data science training. Keep the notebook clean, record the validation method, and explain your trade-offs like an engineer, not just a tool user.
Creating accurate machine learning models is only part of delivering successful AI initiatives. A Marketing & Business Certification helps professionals strengthen their communication and business strategy skills, making it easier to explain technical results, demonstrate organizational value, and align data-driven solutions with broader business goals.
FAQs
1. What is Random Forest in machine learning?
Random Forest is a supervised machine learning algorithm that combines multiple decision trees to improve predictive performance. It uses an ensemble learning approach known as bagging, where each tree is trained on a random subset of the data and features before their predictions are aggregated into a final result.
2. Why is Random Forest important?
Random Forest is popular because it provides strong predictive accuracy, reduces the risk of overfitting compared to a single decision tree, and performs well across many classification and regression tasks. It is also relatively easy to use and requires less hyperparameter tuning than some other ensemble methods.
3. How does Random Forest work?
Random Forest creates numerous decision trees using bootstrap samples of the training data. At each split, the algorithm considers only a random subset of features, increasing diversity among the trees. The final prediction is obtained by majority voting for classification or averaging for regression.
4. What is ensemble learning?
Ensemble learning is a machine learning technique that combines multiple models to produce more accurate and robust predictions than a single model. Random Forest is an example of a bagging-based ensemble, while Gradient Boosting and XGBoost are examples of boosting-based ensembles.
5. What is bagging in Random Forest?
Bagging, or Bootstrap Aggregating, is a method where multiple models are trained independently on randomly sampled subsets of the training data. Combining their predictions reduces variance and generally improves model stability and generalization.
6. Why does Random Forest use random feature selection?
Randomly selecting a subset of features at each tree split encourages diversity among the trees. This reduces correlation between individual trees and often leads to more accurate and reliable ensemble predictions.
7. What problems can Random Forest solve?
Random Forest supports classification, regression, feature importance estimation, anomaly detection support, and certain ranking tasks. It performs well on structured datasets across a wide range of business, scientific, and engineering applications.
8. What are the advantages of Random Forest?
Key advantages include strong predictive performance, reduced overfitting, robustness to noisy data, automatic estimation of feature importance, support for high-dimensional datasets, relatively simple implementation, and good performance with minimal preprocessing.
9. What are the limitations of Random Forest?
Random Forest models can become computationally intensive when using many trees or very large datasets. They may also be less interpretable than a single decision tree and can require significant memory for storing large ensembles.
10. What are the main Random Forest hyperparameters?
Important hyperparameters include the number of trees (n_estimators), maximum tree depth, maximum number of features considered per split, minimum samples required for splitting or leaf nodes, and bootstrap sampling settings. Proper tuning can improve model performance and efficiency.
11. How does Random Forest handle missing values?
Many implementations can tolerate some missing data, but performance generally improves when missing values are handled through appropriate preprocessing or imputation. The exact behavior depends on the software library being used and its implementation details.
12. How does Random Forest compare with Decision Trees?
A single Decision Tree is easy to interpret but may overfit the training data. Random Forest combines many diverse trees to improve predictive accuracy and robustness, although this comes at the cost of reduced interpretability and greater computational requirements.
13. How does Random Forest compare with XGBoost?
Random Forest builds decision trees independently using bagging, while XGBoost builds trees sequentially using gradient boosting to correct previous errors. XGBoost often achieves higher predictive accuracy on structured data but typically requires more hyperparameter tuning than Random Forest.
14. What industries use Random Forest?
Random Forest is widely used in healthcare, banking, insurance, retail, cybersecurity, manufacturing, telecommunications, agriculture, logistics, marketing, and environmental science. Common applications include fraud detection, disease prediction, customer churn analysis, demand forecasting, and predictive maintenance.
15. Which Python libraries support Random Forest?
Popular libraries include Scikit-learn, NumPy, Pandas, SciPy, Matplotlib, Yellowbrick, MLflow, SHAP, and PySpark MLlib. Scikit-learn provides optimized implementations for both Random Forest classification and regression models.
16. What common mistakes should beginners avoid?
Common mistakes include failing to clean the data, ignoring class imbalance, relying only on default hyperparameters, evaluating models solely on training data, overlooking feature engineering, introducing data leakage, and neglecting cross-validation.
17. What are best practices for using Random Forest?
Best practices include preparing high-quality data, selecting relevant features, tuning key hyperparameters, evaluating models with cross-validation, monitoring multiple performance metrics, validating results on independent test datasets, and interpreting feature importance alongside domain knowledge.
18. How does Random Forest fit into MLOps?
Random Forest models can be integrated into automated MLOps pipelines for data preprocessing, model training, experiment tracking, deployment, monitoring, versioning, and periodic retraining. These practices improve reproducibility, scalability, and long-term model maintenance.
19. What trends are shaping Random Forest in 2025-2026?
Current trends include distributed Random Forest training, cloud-native machine learning platforms, AutoML integration, explainable AI using SHAP values, feature store adoption, hybrid AI pipelines, GPU acceleration for large datasets, and tighter integration with enterprise MLOps workflows.
20. What is the future of Random Forest?
Random Forest is expected to remain one of the most dependable algorithms for structured data because of its balance of accuracy, robustness, and ease of use. Although newer ensemble methods and deep learning models continue to advance, Random Forest remains a strong choice for benchmarking, production systems, and interpretable feature analysis across many industries. Sometimes letting an entire forest vote really does produce a wiser answer than trusting a single very confident tree.
Related Articles
View All
Machine Learning
Model Deployment Explained: Moving Machine Learning from Notebook to Production
Learn what model deployment means, how models move from notebooks to production, and which MLOps practices keep systems reliable after release.

Machine Learning
Model Training Explained: How Machine Learning Models Learn
Model training explained with the learning loop, loss functions, backpropagation, gradient descent, mini-batches, validation, and practical debugging tips.

Machine Learning
XGBoost Explained: Why It Wins Machine Learning Competitions
XGBoost explained for practitioners: learn why gradient boosted trees still dominate tabular machine learning competitions and enterprise prediction tasks.
Trending Articles
The Role of Blockchain in Ethical AI Development
How blockchain technology is being used to promote transparency and accountability in artificial intelligence systems.
AWS Career Roadmap
A step-by-step guide to building a successful career in Amazon Web Services cloud computing.
Top 5 DeFi Platforms
Explore the leading decentralized finance platforms and what makes each one unique in the evolving DeFi landscape.