

K-Means Clustering Explained: How to Find Groups in Unlabeled Data
 Suyash Raizada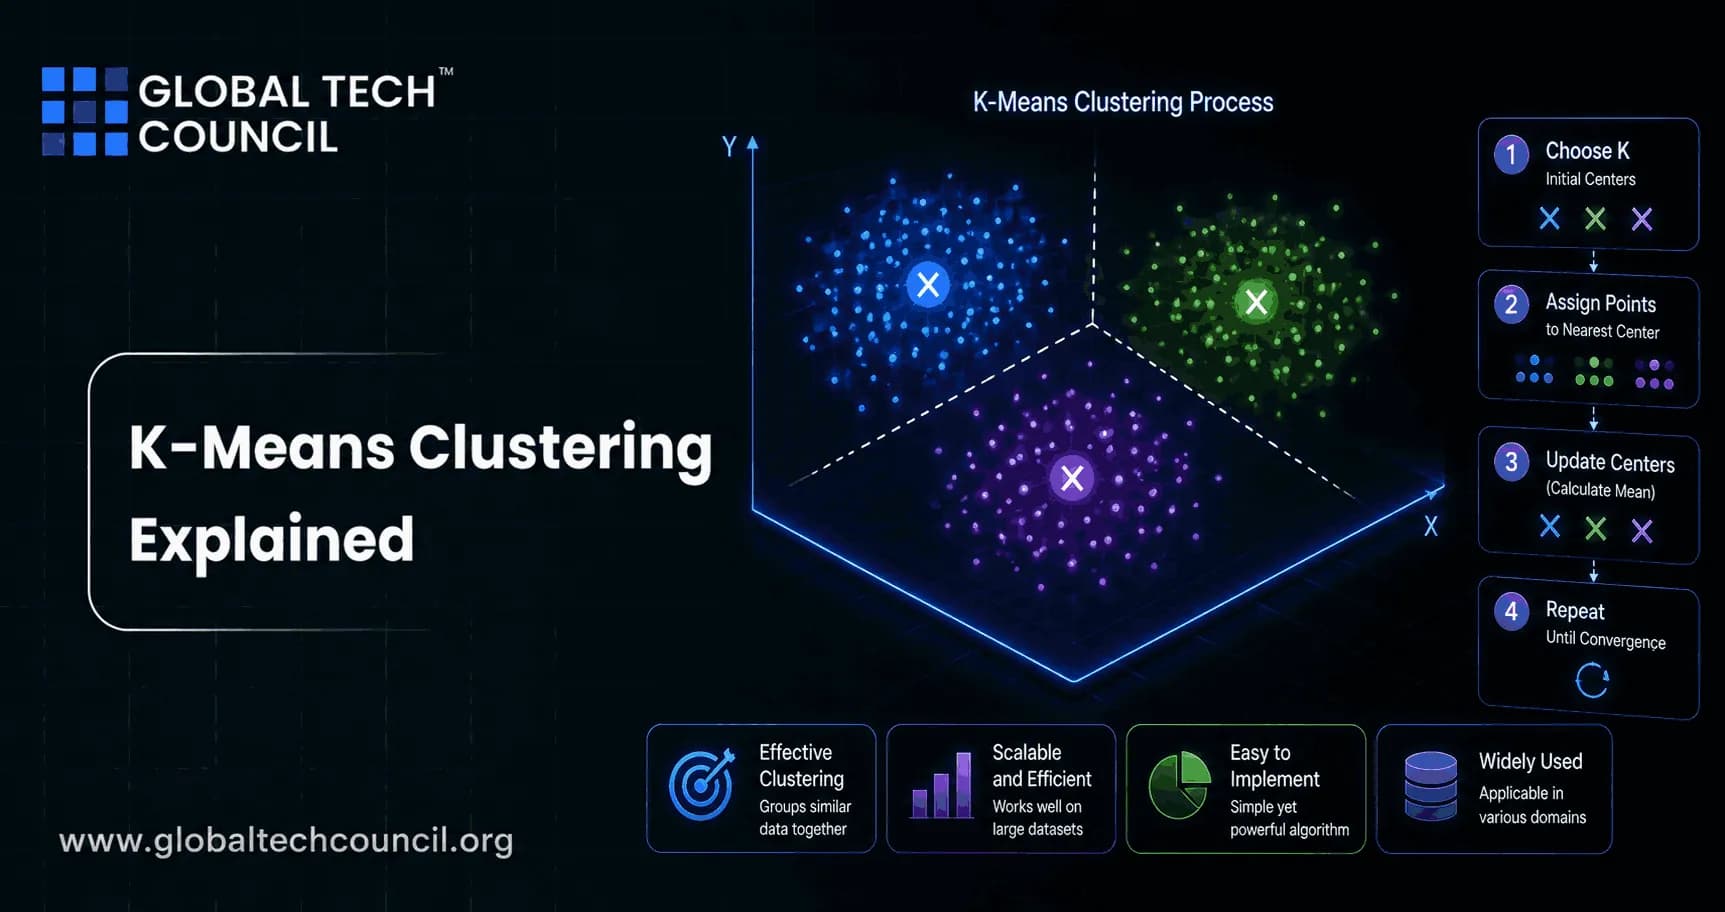
K-Means clustering is the clustering method most teams try first when they need to find groups in unlabeled data. It is simple, fast, and built into tools you probably already use, including scikit-learn, Qlik Sense, Oracle Machine Learning, IBM analytics tooling, and many business intelligence platforms.
The basic idea is direct. Choose a number of groups, called k, place a center point for each group, assign every record to its nearest center, then move the centers until the assignments stop changing much. That is why K-Means clustering shows up in customer segmentation, fraud analysis, route planning, IoT traffic monitoring, and image segmentation.

Understanding how clustering algorithms organize unlabeled data is an important step in developing practical machine learning skills. A Certified Machine Learning Expert credential helps professionals strengthen their knowledge of unsupervised learning, data preprocessing, model evaluation, and clustering techniques, enabling them to apply algorithms like K-Means effectively to real-world business problems.
What K-Means Clustering Actually Does
K-Means is an unsupervised learning algorithm. You use it when you do not have labels such as 'high value customer', 'fraudulent transaction', or 'traffic congestion zone'. Instead, you ask the algorithm to discover structure from the features you provide.
Each cluster is represented by a centroid, which is the mean position of the points assigned to that cluster. In the common version of the algorithm, distance is measured using Euclidean distance. A point belongs to the cluster whose centroid is closest.
That sounds almost too simple. It works because many business datasets contain patterns that are not obvious in a spreadsheet but become visible once records are grouped by similarity.
As organizations increasingly rely on AI-driven analytics, professionals benefit from understanding how clustering fits alongside supervised learning, deep learning, and predictive modeling. A Certified AI & Machine Learning Expert credential provides structured knowledge of these techniques, helping practitioners select and implement the most appropriate AI approach for different analytical challenges.
How the K-Means Algorithm Works
A standard K-Means workflow looks like this:
Choose k: Decide how many clusters you want to find.
Initialize centroids: Pick starting positions, often with k-means++ rather than pure random selection.
Assign points: Send each data point to the nearest centroid.
Update centroids: Recalculate each centroid as the mean of the points assigned to it.
Repeat: Continue the assignment and update steps until the clusters stabilize or the maximum iteration limit is reached.
The objective is to reduce the sum of squared distances between points and their assigned centroids. In practice this is often called inertia, or within-cluster sum of squares. Lower is better, but lower does not automatically mean useful. If you set k equal to the number of rows, inertia becomes zero and the model tells you nothing.
Choosing the Right Number of Clusters
The hardest part of K-Means clustering is usually not running the algorithm. It is choosing k.
Elbow Method
The elbow method plots within-cluster sum of squares against different values of k. You look for the bend where adding more clusters gives smaller gains. It is quick and useful, but it can be subjective. Sometimes there is no clean elbow. That is normal.
Silhouette Score
The silhouette score measures how close a point is to its own cluster compared with other clusters. Scores range from -1 to 1. A score near 1 suggests well-separated clusters. A score near 0 means clusters overlap. Negative values often mean points may be assigned to the wrong cluster.
Gap Statistic
The gap statistic compares your clustering result with what would be expected from random data. It is more formal than the elbow method, though it takes more compute because it uses reference datasets.
Use business logic too. If your operations team can act on three customer segments but not twelve, then twelve clusters may be a technically neat answer and a bad business answer.
Preprocessing Matters More Than Beginners Expect
K-Means is distance-based. That one fact explains most of its practical failures.
If one feature is annual income measured in dollars and another is app sessions per week, income may dominate the distance calculation unless you scale the data. Standardization with mean 0 and standard deviation 1 is a common default. Min-max scaling can work too, especially when feature ranges are meaningful.
Before you run K-Means, handle these issues:
Missing values: Impute them or remove incomplete rows. K-Means implementations generally do not accept NaN values directly.
Feature scaling: Standardize numeric features so large-scale variables do not control the clusters.
Outliers: Extreme points can drag centroids away from dense regions.
Feature selection: Remove redundant or noisy fields. More columns do not always mean better clusters.
Categorical data: Avoid blindly one-hot encoding hundreds of categories and expecting clean clusters.
A scikit-learn warning that often surprises beginners is: ConvergenceWarning: Number of distinct clusters (3) found smaller than n_clusters (5). Possibly due to duplicate points in X. I have seen this when training on heavily rounded transaction features. The fix is not to increase iterations. Check duplicates, low-variance columns, and whether k is too high for the actual data.
K-Means++ and Why Initialization Is Not a Detail
Classic K-Means can land in poor local minima because initial centroids are random. k-means++ improves this by spreading out the initial centroids in a more informed way. It does not guarantee the best clustering, but it reduces the chance of a bad start.
There is a scikit-learn detail worth remembering. In scikit-learn 1.4, the default value of n_init changed to 'auto'. With the default init='k-means++', that usually means one run. With init='random', it uses more runs. If your clustering varies too much between runs, set n_init explicitly, for example 10 or 20, and fix random_state while comparing experiments.
Where K-Means Clustering Works Well
K-Means is a good choice when your data is numeric, reasonably scaled, and likely to form compact groups. It is also useful when you need an interpretable baseline fast.
Common use cases include:
Customer segmentation: Group customers by spend, purchase frequency, product interest, or engagement.
Fraud and cybercrime detection: Cluster normal behavior, then inspect points far from typical clusters.
Logistics: Group delivery locations for route planning or depot assignment.
IoT and smart cities: Cluster traffic flow patterns from sensor streams, as seen in city-scale traffic analysis studies.
Image segmentation: Group pixels by color or feature values to separate visual regions.
Account attrition: Group accounts by activity and risk indicators before prioritizing retention work.
Qlik describes K-Means as a way for business users to group data points for pattern discovery and optimization. IBM and Oracle both frame it as a core unsupervised learning method for finding groups when labels are unavailable. That matches how most data teams use it: not as a final answer every time, but as a practical first lens on messy data.
Where K-Means Is the Wrong Tool
Be blunt with yourself here. K-Means is not magic.
It assumes clusters are roughly spherical in the feature space. It struggles with crescent-shaped clusters, clusters with very different densities, and data where categories dominate the meaning. In those cases, compare alternatives:
DBSCAN: Better for irregular shapes and noise, but sensitive to distance settings.
Gaussian Mixture Models: Useful when you want soft assignments and elliptical clusters.
Hierarchical clustering: Good for exploring nested group structure, often less suitable for very large datasets.
k-modes or k-prototypes: Better choices when categorical features are central.
High-dimensional data is another trap. Distances become less informative as dimensions grow. Use feature selection, principal component analysis, embeddings, or domain-specific representations before clustering.
Scaling K-Means for Modern Datasets
K-Means remains heavily studied because it is useful and imperfect. Recent work focuses on better initialization, parallel processing, sampling, and hybrid methods.
One interesting line of research is k-means lite. Instead of running standard K-Means on the full dataset, it builds sample centroids from small random samples, then runs K-Means on that reduced set. Reported experiments showed that using 30 samples of size 40 + 2k could match standard K-Means across several synthetic and real-world datasets. A k-means lite++ extension produced comparable results to k-means++ in several cases with only five samples.
That matters when you have millions of rows and limited compute. Still, do not start there. First build a clean baseline with standard K-Means or MiniBatchKMeans, then test whether sampling changes the cluster story.
Scaling clustering algorithms for enterprise workloads also requires expertise in cloud computing, distributed systems, software engineering, and cybersecurity. A Deep Tech Certification helps professionals build these advanced technical capabilities, making it easier to deploy scalable, secure, and efficient machine learning solutions across modern technology environments.
A Practical K-Means Checklist
Use this checklist before you trust a clustering result:
Define what a useful cluster means for your domain.
Remove identifiers, timestamps, and leakage columns unless they are intentionally engineered.
Scale numeric features.
Test several k values with elbow and silhouette analysis.
Run multiple initializations and compare stability.
Profile each cluster with original business fields, not only scaled features.
Validate with people who understand the process behind the data.
If two clusters differ only because one feature was measured on a larger scale, you do not have insight. You have a preprocessing bug.
How to Build Skill with K-Means Clustering
If you are learning machine learning for professional work, do not stop at the formula. Build a small project: take customer transaction data, standardize the numeric columns, compare k from 2 to 10, inspect silhouette scores, then explain each cluster in plain language.
For a structured path, connect this topic with Global Tech Council's machine learning, data science, and artificial intelligence certification learning tracks. K-Means sits at the intersection of all three. You need statistical judgment, coding skill, and enough domain context to avoid misleading patterns.
Your next step is simple. Pick one unlabeled dataset you understand, run K-Means with k-means++ initialization, set n_init deliberately, and write a one-page cluster interpretation. If the clusters do not lead to a decision, adjust the features before you adjust the algorithm.
Discovering meaningful clusters is only valuable when those insights can guide business decisions and be communicated clearly to stakeholders. A Marketing & Business Certification helps professionals strengthen their business strategy and communication skills, enabling them to translate machine learning findings into actionable recommendations that support organizational goals.
FAQs
1. What is K-Means clustering?
K-Means clustering is an unsupervised machine learning algorithm that groups similar data points into a predefined number of clusters (K). It identifies patterns in unlabeled data by minimizing the distance between data points and the center, or centroid, of their assigned cluster.
2. Why is K-Means clustering important?
K-Means is one of the most widely used clustering algorithms because it is relatively simple, computationally efficient, and scalable. It helps organizations discover hidden patterns, segment data, and support decision-making without requiring labeled training data.
3. How does K-Means clustering work?
The algorithm begins by selecting K initial centroids, assigns each data point to the nearest centroid, recalculates the centroid positions based on the assigned points, and repeats these steps until cluster assignments stabilize or a stopping criterion is reached.
4. What does the value of K represent?
K represents the number of clusters the algorithm will create. Selecting an appropriate value is important because too few clusters may oversimplify the data, while too many clusters may capture noise rather than meaningful structure.
5. How do you choose the optimal number of clusters?
Common methods include the Elbow Method, Silhouette Analysis, the Gap Statistic, and domain knowledge. These approaches help evaluate how well different cluster counts represent the underlying structure of the data, although there is rarely a universally correct value.
6. What are centroids in K-Means?
Centroids are the central points representing each cluster. During training, the algorithm repeatedly updates centroid locations by calculating the average position of all data points assigned to each cluster.
7. What distance metric does K-Means use?
K-Means most commonly uses Euclidean distance to measure similarity between data points and cluster centroids. Alternative distance metrics may be appropriate for other clustering algorithms, but standard K-Means is designed around Euclidean geometry.
8. Why is feature scaling important for K-Means?
Because K-Means relies on distance calculations, features with larger numerical ranges can dominate the clustering process. Scaling techniques such as standardization or normalization help ensure that all features contribute more evenly to cluster formation.
9. What types of data work best with K-Means?
K-Means performs best on numerical, continuous data where clusters are relatively compact, spherical, and similarly sized. It is generally less effective for categorical data, highly irregular cluster shapes, or datasets with significant noise.
10. What are the advantages of K-Means clustering?
Advantages include simplicity, fast computation, scalability to large datasets, ease of implementation, and broad availability in machine learning libraries. It is often used as a baseline clustering method before exploring more advanced techniques.
11. What are the limitations of K-Means?
K-Means requires the number of clusters to be specified in advance, is sensitive to the initial placement of centroids, performs poorly on non-spherical clusters, and can be influenced by outliers and features with inconsistent scales.
12. How does K-Means compare with hierarchical clustering?
K-Means partitions data into a predefined number of clusters, while hierarchical clustering builds nested relationships between data points without requiring a fixed number of clusters at the outset. The appropriate choice depends on the dataset size, computational requirements, and analytical objectives.
13. What are common applications of K-Means clustering?
K-Means is widely used for customer segmentation, market research, recommendation systems, image compression, document clustering, anomaly detection support, healthcare analytics, geographic analysis, inventory grouping, and exploratory data analysis.
14. Which industries use K-Means clustering?
Industries including retail, banking, healthcare, telecommunications, manufacturing, logistics, marketing, insurance, education, and cybersecurity use K-Means to identify customer groups, operational patterns, and data-driven insights for business decision-making.
15. Which Python libraries support K-Means clustering?
Popular libraries include Scikit-learn, SciPy, NumPy, Pandas, Yellowbrick, Matplotlib, Plotly, TensorFlow, and PySpark MLlib. These tools support clustering, visualization, preprocessing, evaluation, and scalable machine learning workflows.
16. What common mistakes should beginners avoid?
Common mistakes include choosing an arbitrary value for K, skipping feature scaling, ignoring outliers, clustering irrelevant features, failing to evaluate cluster quality, assuming clusters always represent meaningful business segments, and interpreting results without domain knowledge.
17. What are best practices for using K-Means?
Best practices include cleaning and scaling data, selecting relevant features, testing multiple values of K, evaluating clusters using metrics such as the Silhouette Score, visualizing results where possible, validating findings with domain expertise, and documenting preprocessing decisions.
18. How does K-Means fit into the machine learning lifecycle?
K-Means is commonly used during exploratory data analysis and feature engineering to uncover hidden patterns or generate new cluster-based features. In production environments, clustering models can be incorporated into automated data pipelines, monitored for performance, and periodically retrained as data evolves.
19. What trends are shaping clustering techniques in 2025-2026?
Current trends include scalable clustering for big data, automated cluster selection, AI-assisted exploratory analytics, integration with feature stores, hybrid clustering approaches, cloud-native machine learning workflows, explainable clustering methods, and tighter integration with AutoML platforms.
20. What is the future of K-Means clustering?
K-Means is expected to remain a foundational clustering algorithm because of its simplicity, efficiency, and educational value. While newer clustering methods continue to address more complex data structures, K-Means will likely remain a common first choice for exploratory analysis and structured data segmentation due to its speed, interpretability, and widespread software support. Even when the data seems determined to form a social club with mysterious membership rules, K-Means does its best to organize the gathering one centroid at a time.
Related Articles
View All
Machine Learning
Naive Bayes Algorithm Explained: Fast Classification for Text and Data
Naive Bayes algorithm explained for fast text and data classification, with variants, TF-IDF workflows, use cases, trade-offs, and Python tips.

Machine Learning
Semi-Supervised Learning Explained: Training Models with Limited Labeled Data
Semi-supervised learning uses limited labeled data plus larger unlabeled datasets to train accurate models while reducing annotation effort.

Machine Learning
Unsupervised Learning Explained: Clustering, Patterns, and Real-World Applications
Learn how unsupervised learning finds clusters, anomalies, and hidden patterns in unlabeled data, with practical use cases across security, healthcare, supply chain, and marketing.
Trending Articles
The Role of Blockchain in Ethical AI Development
How blockchain technology is being used to promote transparency and accountability in artificial intelligence systems.
AWS Career Roadmap
A step-by-step guide to building a successful career in Amazon Web Services cloud computing.
Top 5 DeFi Platforms
Explore the leading decentralized finance platforms and what makes each one unique in the evolving DeFi landscape.