

Linear Regression in Machine Learning: Concepts, Assumptions, and Examples
 Suyash Raizada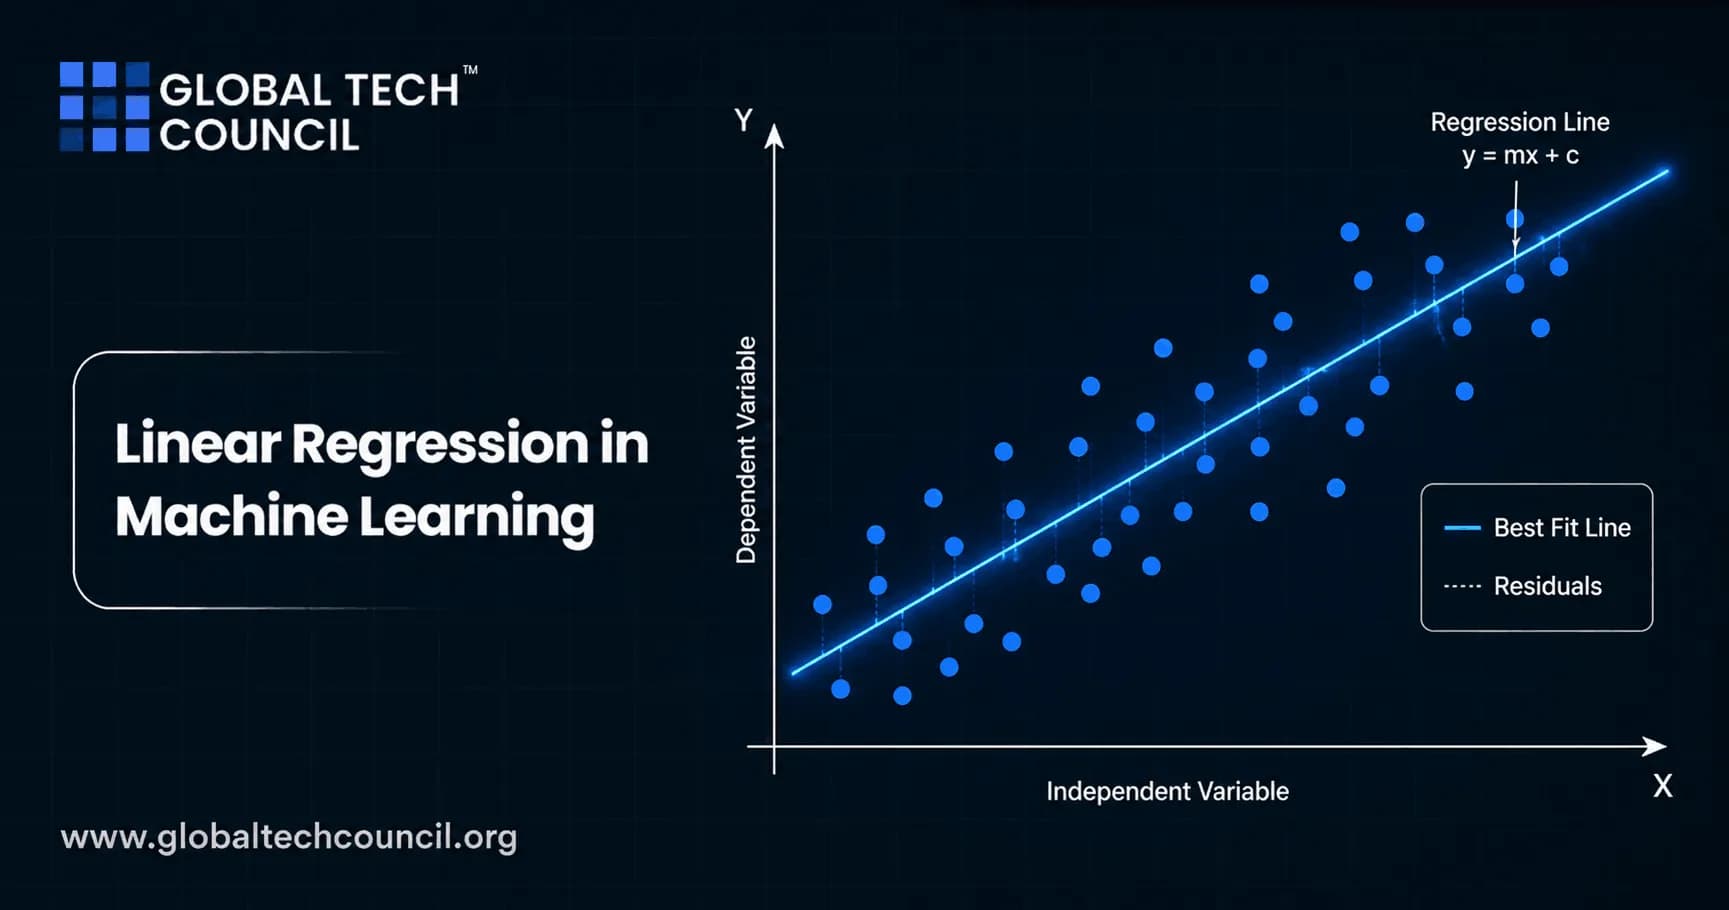
Linear regression in machine learning is the model you should try before you reach for a neural network, gradient boosting, or a complex forecasting stack. It predicts a continuous value, explains how inputs relate to an outcome, and gives you a baseline that is hard to beat when the signal is mostly linear.
That last phrase matters: mostly linear. Linear regression is simple, not simplistic. Used well, it can support sales forecasting, pricing analysis, risk modeling, clinical research, and operations planning. Used carelessly, it produces precise-looking numbers that are wrong.

Learning linear regression is an essential step toward understanding supervised machine learning because it introduces the core concepts of prediction, feature relationships, and model evaluation. A Certified Machine Learning Expert credential helps professionals strengthen these fundamentals, preparing them to build reliable predictive models and confidently progress to more advanced machine learning techniques.
What Is Linear Regression in Machine Learning?
Linear regression is a supervised learning algorithm for predicting a continuous target variable. The model assumes the expected value of the target can be written as a weighted sum of input features plus an error term.
For simple linear regression, the model is:
Y = β0 + β1X + ε
Here, Y is the target, X is the predictor, β0 is the intercept, β1 is the slope, and ε is the error term.
For multiple linear regression, the model becomes:
Y = β0 + β1X1 + β2X2 + ... + βpXp + ε
The coefficients are usually estimated using ordinary least squares, or OLS. OLS chooses the coefficients that minimize the sum of squared residuals, where a residual is the difference between the observed value and the predicted value.
In practice, linear regression is valued for three reasons:
Interpretability: Coefficients show the estimated change in the target for a one-unit change in a feature, assuming the other features stay fixed.
Speed: Training is fast, even on fairly large tabular datasets.
Baseline value: It gives you a clean benchmark before you test Random Forest, XGBoost, or deep learning models.
A practical warning from real projects: in statsmodels.api.OLS, an intercept is not added automatically. You usually need sm.add_constant(X). In scikit-learn, LinearRegression uses fit_intercept=True by default. That one difference has caused many confusing model reviews.
Although linear regression is one of the simplest predictive models, it provides the conceptual foundation for many advanced analytics and AI techniques. A Certified AI & Machine Learning Expert credential helps professionals understand how linear models fit alongside ensemble methods, deep learning, and modern machine learning workflows, enabling better algorithm selection for different business challenges.
Key Concepts Behind Linear Regression
Coefficients
A coefficient estimates the relationship between a predictor and the target. If a sales model gives advertising spend a coefficient of 3.2, the model estimates that each additional unit of spend is associated with 3.2 extra units of sales, holding other variables constant.
Do not overread this. A coefficient is not automatically causal. If discounts, seasonality, and competitor pricing are missing, your advertising coefficient may be absorbing their effects.
Intercept
The intercept is the predicted value when all predictors are zero. Sometimes it is meaningful. Often it is just a mathematical anchor. Predicting house prices when square footage is zero is not useful, but the intercept still helps position the fitted line.
Residuals
Residuals are where the truth hides. A model can have a decent R-squared value and still show curved residual patterns, funnel shapes, or time-based drift. Always inspect residuals before trusting interpretation.
R-squared and Error Metrics
R-squared measures the proportion of variance in the target explained by the model. It is useful, but it can mislead when features are added without care. Adjusted R-squared helps in classical regression settings, while machine learning workflows usually rely on train-test validation.
For prediction, use metrics such as:
Mean Absolute Error (MAE): Easy to explain to business users.
Root Mean Squared Error (RMSE): Penalizes large errors more heavily.
R-squared: Helpful for model comparison, but not enough by itself.
Core Assumptions of Linear Regression
Linear regression assumptions are not academic decoration. They decide whether your coefficients, confidence intervals, and hypothesis tests can be trusted.
1. Linearity and Additivity
The model assumes the target has a linear relationship with each predictor, after accounting for the other predictors. Effects are also assumed to be additive. If revenue rises sharply after a certain traffic threshold, a plain straight-line model may underfit.
Check this with residual plots. Curvature in residuals is a common sign that you need transformations, polynomial terms, splines, or a different model.
2. Independence of Errors
Residuals should be independent. This matters most in time series data. If today's residual is related to yesterday's residual, the model has missed time structure.
For time-ordered data, plot residuals over time and inspect autocorrelation. If you see clear cycles, linear regression may still be useful, but you may need lag features or a time series model.
3. Homoscedasticity
Homoscedasticity means residuals have roughly constant variance across predicted values. A funnel-shaped residual plot, narrow on the left and wide on the right, is a classic warning sign.
Heteroscedasticity can make standard errors unreliable. That matters if you are reporting p-values or confidence intervals. For prediction, it also tells you that errors are larger in some value ranges than others.
4. Normality of Residuals
Classical inference assumes residuals are normally distributed with mean zero. This supports t tests, F tests, and confidence intervals. The model can still predict reasonably well when residuals are not perfectly normal, especially with large samples, but strong skew or heavy tails deserve attention.
Use a Q-Q plot and histogram. Do not rely on a single normality test for a large dataset, because tiny departures can become statistically significant while having little practical effect.
5. No Severe Multicollinearity
Predictors should not be too highly correlated. If price, discount rate, and net price all enter the same model, coefficients may swing wildly while predictions remain stable. That is multicollinearity.
Variance Inflation Factor, or VIF, is a common diagnostic. A VIF above 5 deserves review. A VIF above 10 is often treated as a serious warning, though context matters.
6. Correct Model Specification
The model should include the main variables that explain the outcome, and the functional form should be suitable. Omitted variables can bias coefficients. Bad feature design can do the same.
To be blunt, a clean regression table does not rescue a badly specified model.
7. Enough Data
A common applied rule is to target at least 20 observations per predictor in multiple regression. It is not a law, but it is a useful guardrail. With small samples and many features, coefficients become unstable and validation error tends to surprise you.
How to Check Linear Regression Assumptions
Use diagnostics early, not after the presentation deck is finished.
Residuals vs fitted values: Look for curvature, funnels, and clusters.
Residuals vs each predictor: Finds nonlinear feature relationships that a fitted plot can hide.
Q-Q plot: Checks whether residuals follow a roughly normal pattern.
Histogram of residuals: Quick scan for skew and outliers.
VIF: Detects unstable coefficients caused by correlated predictors.
Residuals over time: Finds autocorrelation and drift in time-ordered data.
Outliers need special care. Do not delete them just because they are inconvenient. First ask whether they are data errors, rare but valid events, or evidence that the model is missing a segment.
Linear Regression Examples in Real Work
Marketing and Sales Forecasting
A sales team may model monthly sales using advertising spend, average discount, web traffic, and seasonal indicators. Linear regression can estimate marginal effects and produce a forecast. It is also easy to explain to finance leaders who need budget justification.
Finance and Risk
Linear models are widely used to estimate exposure to market factors. A portfolio return model might relate fund returns to market index returns and sector factors. The coefficients help analysts understand risk exposure, not just prediction accuracy.
Operations and Demand Planning
Demand planners often start with linear regression using historical orders, promotions, lead times, and macro indicators. If residuals show holiday spikes or stockout effects, feature engineering is usually the next step.
Human Resources Analytics
For HR, regression can help estimate how salary, tenure, engagement score, and workload relate to a continuous outcome such as performance rating or absenteeism days. If the target is employee turnover as yes or no, use logistic regression instead.
Healthcare and Biomedical Research
Clinical researchers use regression to study relationships between measurements such as biomarkers, age, dosage, and continuous outcomes. In this setting, assumptions and residual analysis are critical because interpretation may influence policy or treatment research.
When Linear Regression Is the Wrong Choice
Use another method when the target is categorical, the relationship is strongly nonlinear, or the error structure violates key assumptions in ways you cannot fix. For classification, use logistic regression, decision trees, or other classifiers. For nonlinear tabular problems, tree-based models often perform better. For complex image, audio, or language tasks, linear regression is usually the wrong tool.
Still, try it as a baseline. If a complex model beats linear regression by only a tiny margin, the simpler model may be the better production choice because it is easier to audit and monitor.
Linear Regression and Modern Machine Learning Practice
Linear regression remains central because modern AI teams still need transparent models. Regulated areas such as credit, insurance, and clinical analytics often require explanations that stakeholders can inspect. Linear models also teach core ideas that transfer directly to advanced work: loss functions, regularization, feature scaling, residuals, the bias-variance trade-off, and validation.
Regularized variants such as Ridge and Lasso regression build on the same foundation. Ridge regression reduces coefficient instability when predictors are correlated. Lasso can shrink some coefficients to zero, which helps with feature selection. These are not replacements for understanding assumptions. They are extensions.
Building production-ready machine learning solutions also requires expertise in cloud infrastructure, software engineering, scalable deployment, and cybersecurity. A Deep Tech Certification helps professionals develop these advanced technical capabilities, enabling them to deploy secure, efficient, and enterprise-scale AI systems that perform reliably beyond the experimentation stage.
If you are building a structured learning path, connect this topic with Global Tech Council resources in machine learning, data science, and Python programming. Linear regression is usually the first model that makes the rest of supervised learning easier to understand.
Next Step for Practitioners
Take a real CSV file, fit a linear regression model, and produce four plots: residuals vs fitted values, Q-Q plot, residual histogram, and residuals over time if the data is ordered. Then write down what each coefficient means in plain English. If you cannot explain the coefficients, the model is not ready for use.
After that, compare the model against Ridge regression, Lasso regression, and a tree-based method. Keep the linear model if it performs well enough and gives the clearest explanation. Move to a more complex model only when the data earns it.
Successful data science projects depend not only on accurate models but also on the ability to communicate insights that influence business decisions. A Marketing & Business Certification helps professionals strengthen their strategic thinking and communication skills, making it easier to translate analytical findings into actionable recommendations that support organizational growth and decision-making.
FAQs
1. What is linear regression in machine learning?
Linear regression is a supervised machine learning algorithm used to predict continuous numerical values by modeling the relationship between one or more input features and a target variable. It fits a linear equation to the data, making it one of the most widely used techniques for regression analysis and predictive modeling.
2. Why is linear regression important?
Linear regression is valued for its simplicity, interpretability, and computational efficiency. It serves as a foundational algorithm in statistics and machine learning, providing a reliable baseline model and helping analysts understand relationships between variables.
3. How does linear regression work?
Linear regression estimates the best-fitting line, or hyperplane in higher dimensions, that minimizes the difference between predicted and actual values. The model learns coefficients for each feature that describe how changes in the inputs affect the predicted output.
4. What is the linear regression equation?
For simple linear regression, the equation is typically expressed as y = mx + b, where y is the predicted value, x is the input feature, m is the slope (coefficient), and b is the intercept. Multiple linear regression extends this equation to include several input variables.
5. What is the difference between simple and multiple linear regression?
Simple linear regression uses one independent variable to predict a target value, while multiple linear regression uses two or more independent variables. Multiple regression allows the model to capture the combined influence of several predictors on the outcome.
6. What assumptions does linear regression make?
Linear regression assumes a linear relationship between predictors and the target, independent observations, constant variance of residuals (homoscedasticity), minimal multicollinearity among predictors, and approximately normally distributed residuals for certain statistical inference tasks.
7. What are coefficients in linear regression?
Coefficients represent the estimated impact of each input feature on the target variable. A positive coefficient indicates that the predicted value tends to increase as the feature increases, while a negative coefficient indicates an inverse relationship, assuming other variables remain constant.
8. What is the intercept in linear regression?
The intercept is the predicted value of the target variable when all input features equal zero. Although it may not always have practical significance, it is an important part of the regression equation and contributes to accurate predictions.
9. What is Ordinary Least Squares (OLS)?
Ordinary Least Squares (OLS) is the most common method for estimating regression coefficients. It determines the line that minimizes the sum of the squared differences between the observed values and the model's predictions.
10. How is model performance evaluated in linear regression?
Common evaluation metrics include Mean Absolute Error (MAE), Mean Squared Error (MSE), Root Mean Squared Error (RMSE), Mean Absolute Percentage Error (MAPE), and the coefficient of determination (R²). Multiple metrics are often used together to assess model performance comprehensively.
11. What are the advantages of linear regression?
Linear regression is easy to understand, computationally efficient, highly interpretable, performs well on many structured datasets, supports statistical inference, and serves as a valuable benchmark for comparing more complex machine learning models.
12. What are the limitations of linear regression?
Linear regression assumes linear relationships and may struggle with highly nonlinear data. It can also be sensitive to outliers, multicollinearity, missing values, and violations of its underlying assumptions, which may reduce predictive accuracy.
13. What is regularization in linear regression?
Regularization helps prevent overfitting by adding penalties to the model's coefficients during training. Common approaches include Ridge Regression (L2 regularization), Lasso Regression (L1 regularization), and Elastic Net, which combines both techniques.
14. What industries use linear regression?
Linear regression is widely used in finance, healthcare, retail, manufacturing, marketing, insurance, education, agriculture, energy, and real estate. Common applications include sales forecasting, price prediction, demand estimation, resource planning, and performance analysis.
15. Which Python libraries support linear regression?
Popular libraries include Scikit-learn, Statsmodels, NumPy, Pandas, SciPy, Matplotlib, TensorFlow, and PyTorch. Scikit-learn is commonly used for predictive modeling, while Statsmodels provides detailed statistical analysis and regression diagnostics.
16. What common mistakes should beginners avoid?
Common mistakes include ignoring data preprocessing, overlooking outliers, failing to check model assumptions, using correlated predictors without evaluation, introducing data leakage, relying on a single evaluation metric, and interpreting correlation as causation.
17. What are best practices for using linear regression?
Best practices include cleaning and exploring the data, validating model assumptions, selecting meaningful features, applying cross-validation, monitoring multiple evaluation metrics, comparing baseline models, documenting experiments, and interpreting results within the problem domain.
18. How does linear regression fit into the machine learning lifecycle?
Linear regression is often used for exploratory analysis, baseline modeling, and production prediction systems. It integrates smoothly into machine learning pipelines involving preprocessing, feature engineering, evaluation, deployment, monitoring, and periodic model retraining.
19. What trends are shaping linear regression in 2025-2026?
Current trends include automated feature selection, integration with AutoML platforms, explainable AI, cloud-native analytics, privacy-preserving machine learning, MLOps automation, feature stores, and hybrid workflows that combine classical statistical methods with modern AI techniques.
20. What is the future of linear regression?
Linear regression is expected to remain one of the most important algorithms in data science because of its transparency, efficiency, and strong statistical foundation. While advanced machine learning models continue to solve increasingly complex problems, linear regression remains an essential tool for benchmarking, interpretation, forecasting, and many structured data applications where simplicity and explainability matter. Sometimes the straightest line really is the smartest place to begin before inviting a crowd of far more complicated algorithms to the meeting.
Related Articles
View All
Machine Learning
Machine Learning vs Artificial Intelligence: Key Differences and Examples
Understand Machine Learning vs Artificial Intelligence with clear definitions, examples, use cases, differences, and practical learning paths.

Machine Learning
What Is Machine Learning? A Beginner's Guide to Core Concepts
Learn what machine learning is, how models learn from data, the main ML types, real use cases, ethical issues, and where beginners should start.

Machine Learning
Machine Learning Engineer Interview Prep: 25 Concepts and Questions to Master in 2025-2026
Master the 25 most common ML engineer interview concepts for 2025-2026, including ML theory, coding, system design, MLOps, LLMs, and behavioral deep dives.
Trending Articles
The Role of Blockchain in Ethical AI Development
How blockchain technology is being used to promote transparency and accountability in artificial intelligence systems.
AWS Career Roadmap
A step-by-step guide to building a successful career in Amazon Web Services cloud computing.
Top 5 DeFi Platforms
Explore the leading decentralized finance platforms and what makes each one unique in the evolving DeFi landscape.